xStack
®
DGS-3426G Layer 2 Gigabit Ethernet Managed Switch
295
Packets
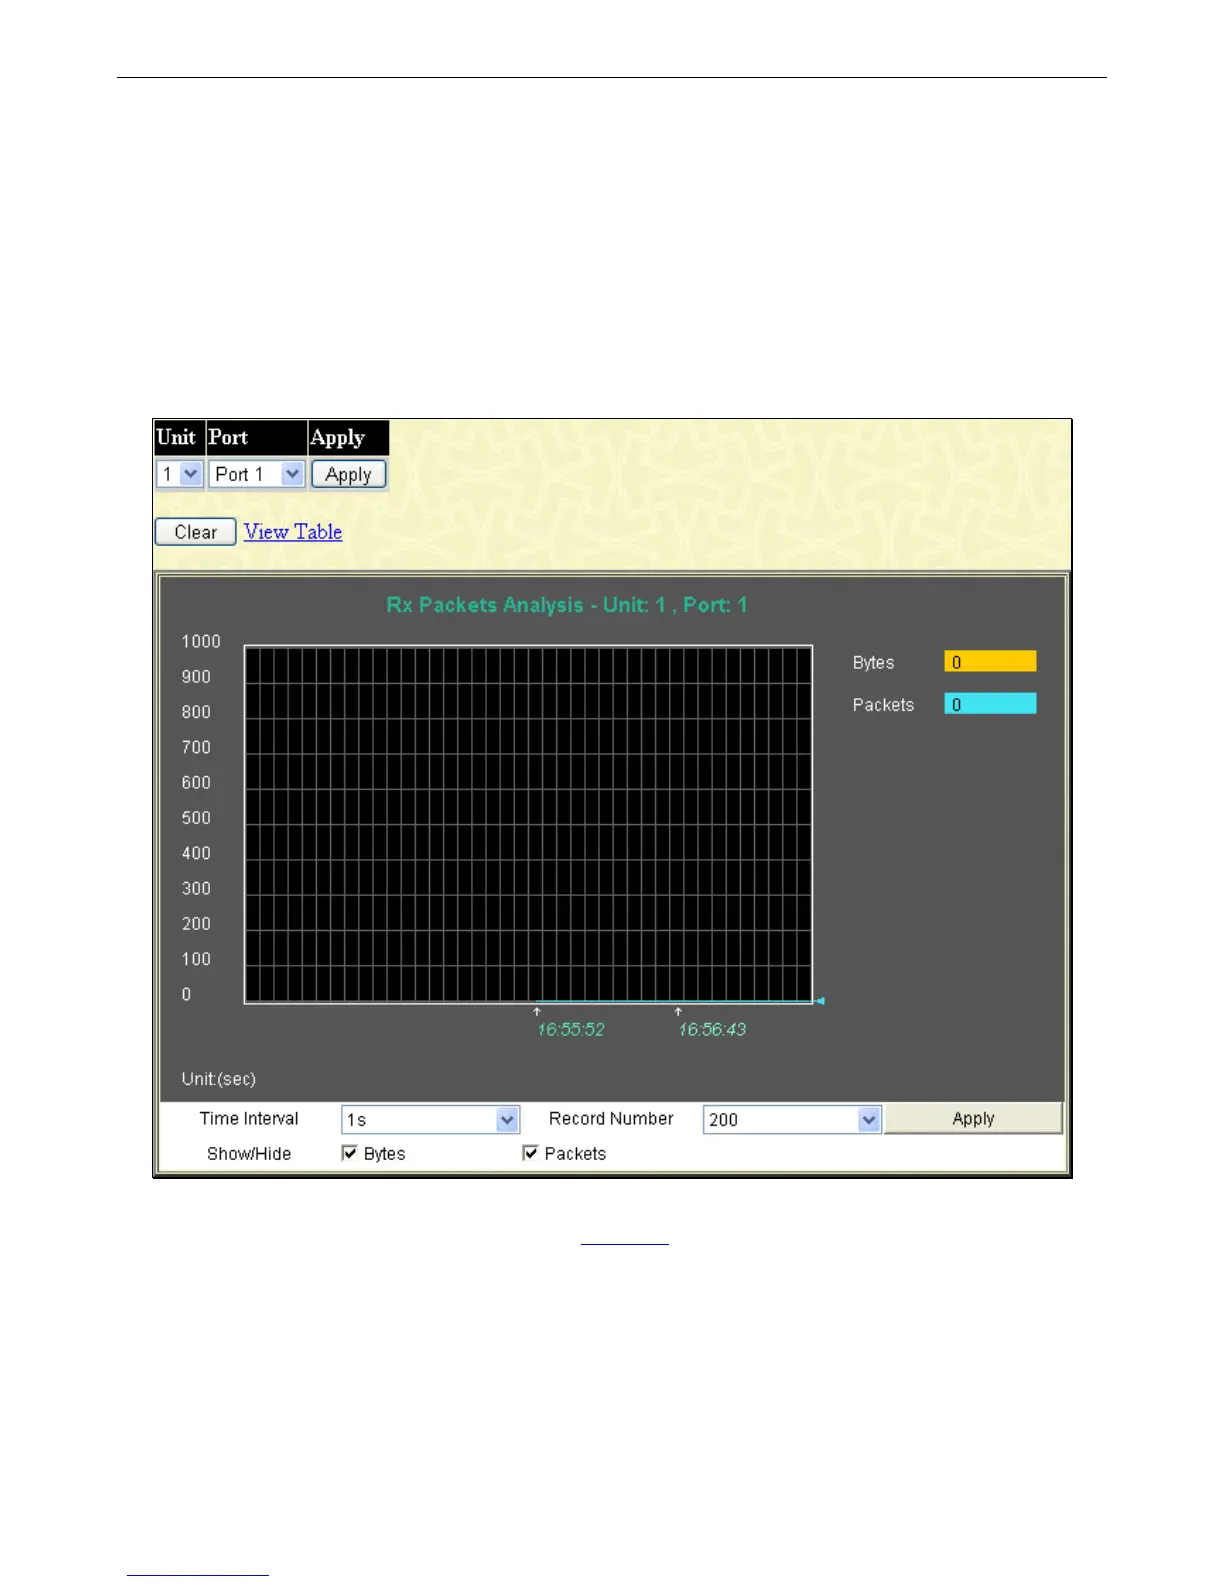
The Web Manager allows various packet statistics to be viewed as either a line graph or a table. Six windows are offered.
Received (Rx)
This window displays the following graph of packets received on the Switch. To select a port to view these statistics for, first
select the Switch in the switch stack by using the Unit drop-down menu and then select the port by using the Port drop-down
menu. The user may also use the real-time graphic of the Switch and/or switch stack at the top of the window by simply clicking
on a port.
To view this window, click, Monitoring > Packets > Received (Rx), as shown below:
Figure 7 - 7 Rx Packets Analysis (line graph for Bytes and Packets)
To view the Received Packets Table window, click the link View Table.