M I N I - C U B E – U S E R M A N U A L
Rev 1.3 06/2018 38/59
The following Westgard rules are used in the control chart:
- 1
2s:
A control value exceeds the mean of two standard deviations.
- 1
3S:
A control value exceeds the mean of three standard deviations.
- 2
2S:
Two consecutive values exceed the mean of two standard deviations
on the same side of the mean.
- R
4S:
The difference between two consecutive values exceeds the four
standard deviations.
- 4
1S:
Four consecutive values exceed the mean of a standard deviation on
the same side.
- 10
x:
Ten consecutive values fall on the same side compared to the
mean.
Press the Export icon to print the list of data of for a selected control
or to search and filter by lot.
Performing QC analysis
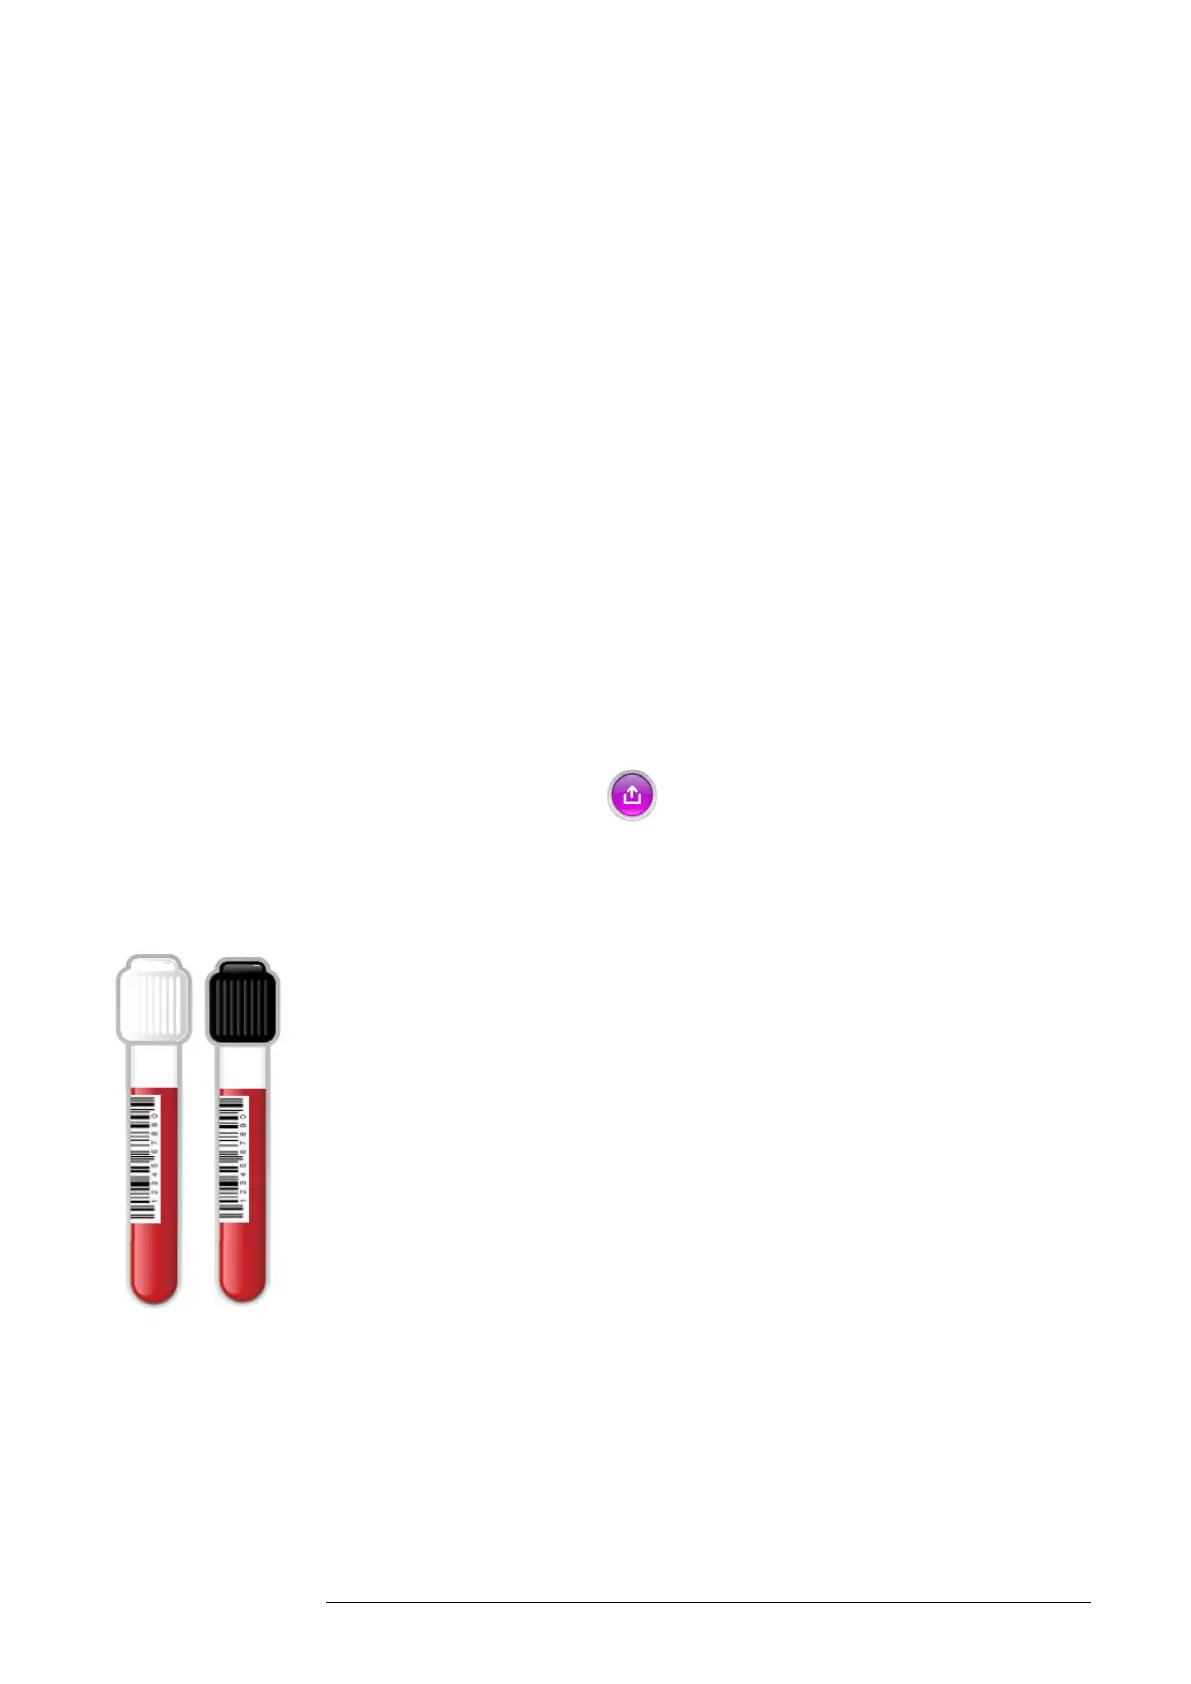
Control materials are processed in the same manner as patient blood sample
(See chapter 4). To run a QC sample, scan the QC barcode (previously recorded
in the settings menu), and then load in any free position. The MINI-CUBE will
recognize a QC tube by the registered lot number, and will display an image on
the screen with a barcode label, whether the QC sample is manually entered or
barcoded, as shown in Fig. 5.2. The tube with a white cap indicates a Normal
level control while the tube with a black cap indicates an Abnormal level control.