90
6. Operation
6.1
Getting Started
Figure 6.1.4 Figure 6.1.5
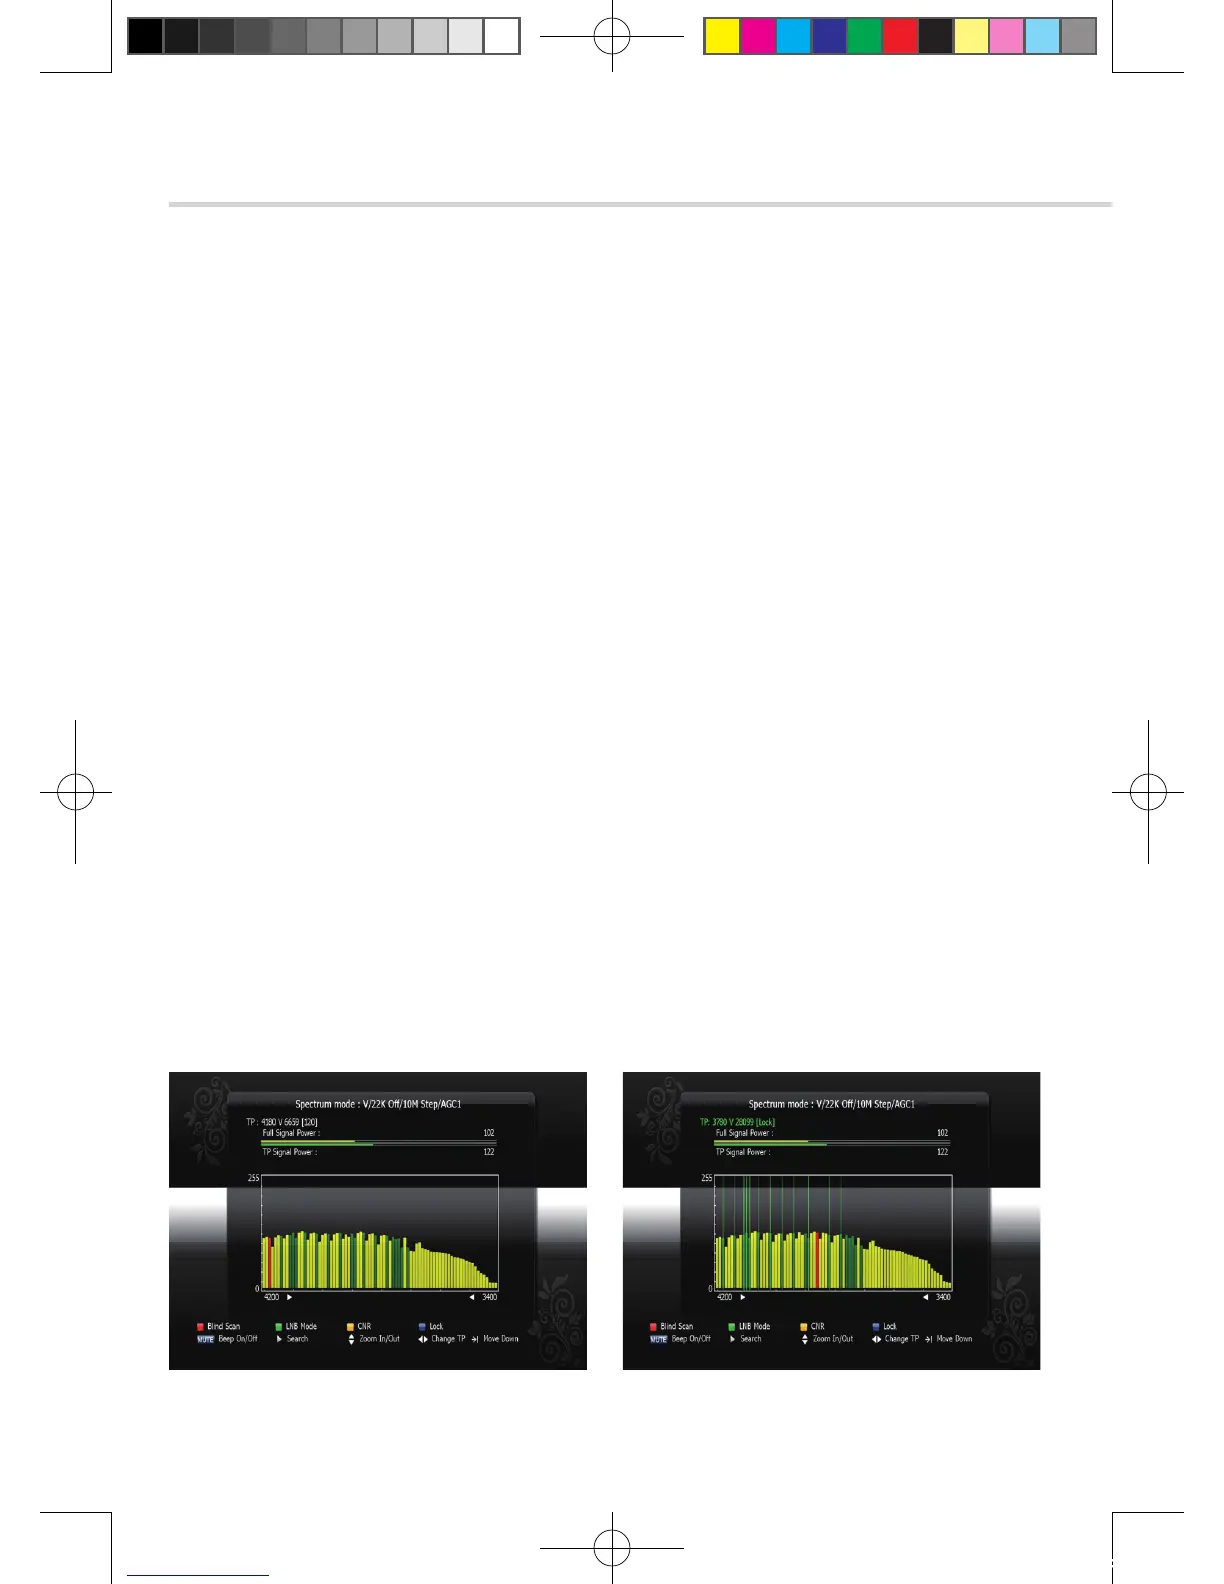
▣ SPECTRUM ANALYSER
General information
The spectrum is displayed as histogram. YELLOW bars indicate signal presence. Green bars
indicate signal presence and transponder presence of the selected satellite. RED bars indicate the
frequency of the selected transponder. Shiny GREEN bars indicate the locked frequencies.
Here you can see ratio: locked transponders / all transponders.
The bars height indicates the LNB input mode of the receiver. High values (close to 255)
show that input signal is suppressed by the attenuator at high degree and input signal
overload can occur. Low values (close to 0) show the maximum boost of the input signal.
Noise level may highly interfere with the input signal in this case. The best quality signal is
normally displayed in the upper part of the graph and does not exceed the limits.
▪ Blind Scan(Red button): The receiver searches for all the available channels
▪ LNB Mode (Green button): You can switch LNB mode quickly.( 22K ON / OFF, H /V)
▪ Yellow button: AGC1 / CNR
▪ LOCK (Yellow button): Press “LOCK” YELLOW button to verify all the transponders indicated
by all the Green bars visible in the active window, Locked TP shown shiny green.
▪ Beep On/Off (Mute button): It expresses the value of the level to signal.
▪ Search: Find all satellites that can be give signal to receiver. : locking
▪ Zoom In/out: Zoom funct ion is used for detai led display of the histogram.
It allows locate transponders which are not in the preset list, set the expected frequency range
▪ Change TP: Move using < , > button. red bar shown current selected TP.
[2012.10.12]D15+F15_russian+english.indd 90 2012-10-12 11:23:06