VigorAP 910C User’s Guide
201
3
3
.
.
1
1
6
6
.
.
3
3
T
T
r
r
a
a
f
f
f
f
i
i
c
c
G
G
r
r
a
a
p
p
h
h
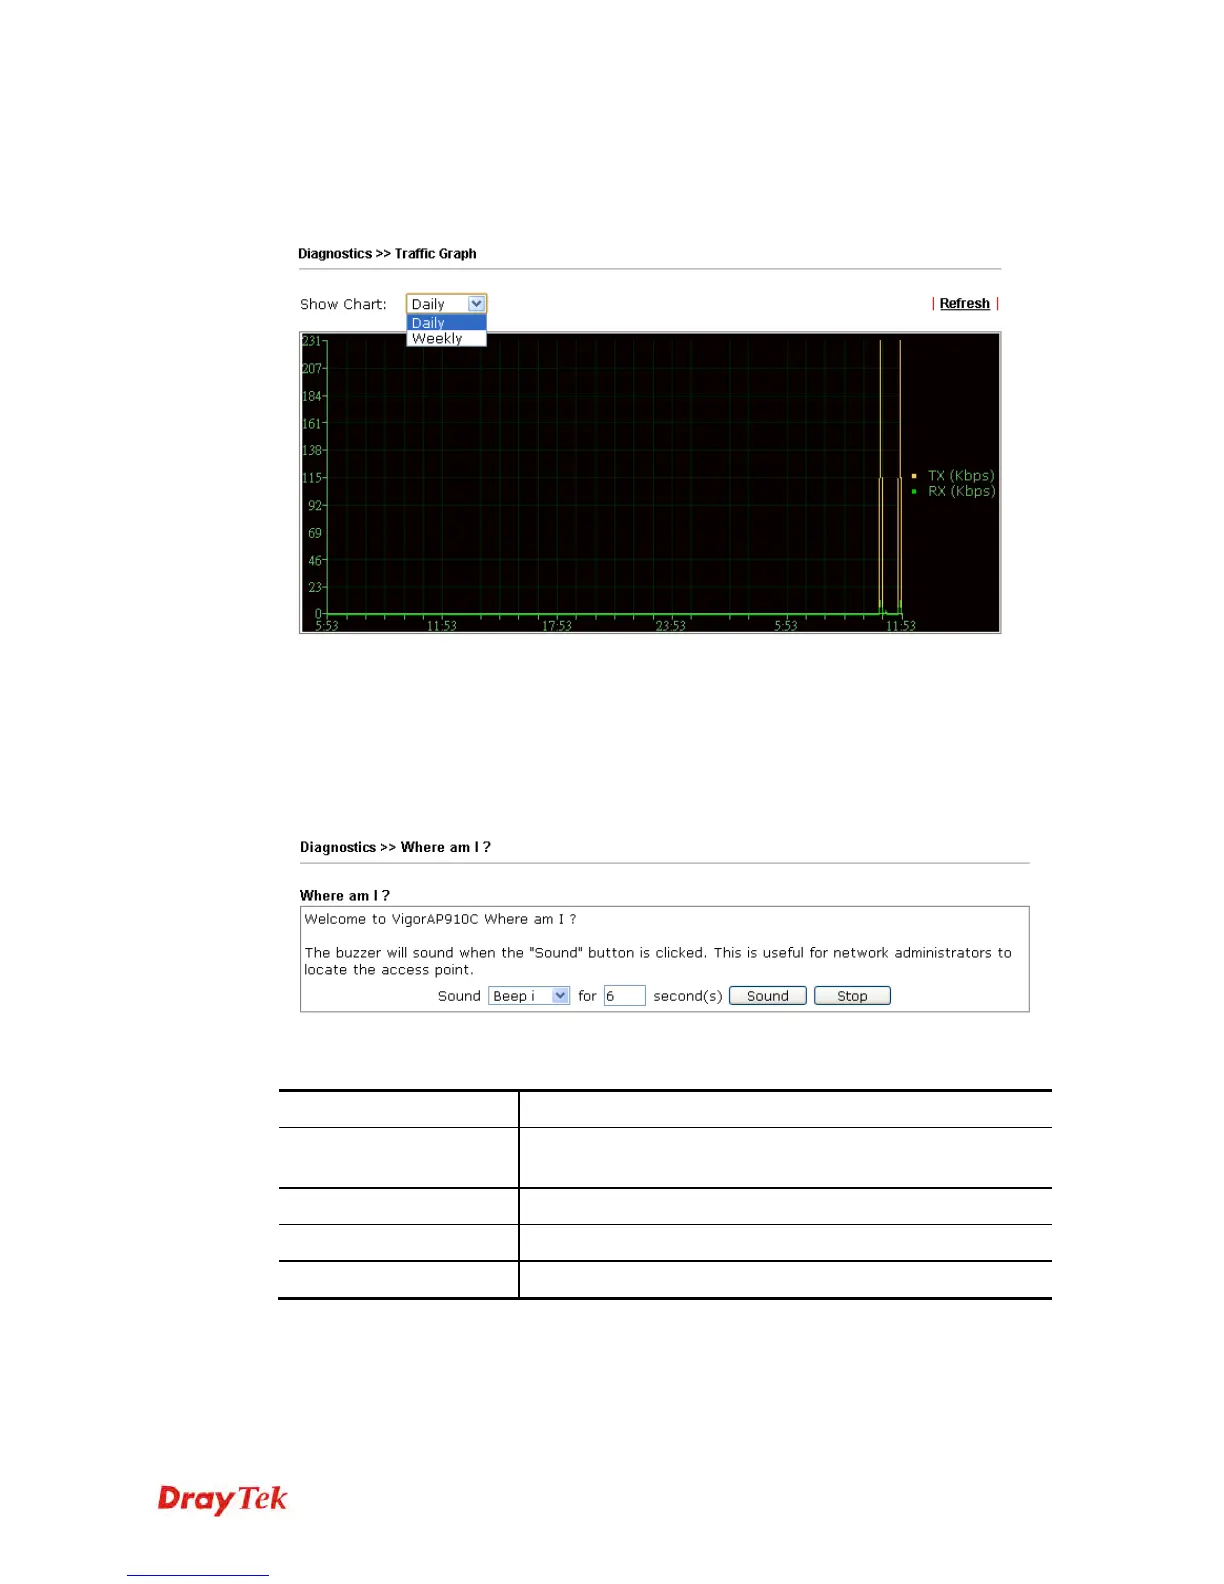
Click Traffic Graph to open the web page. Choose one of the managed Access Points, daily
or weekly for viewing data transmission chart. Click Refresh to renew the graph at any time.
The horizontal axis represents time; the vertical axis represents the transmission rate (in
kbps).
3
3
.
.
1
1
6
6
.
.
4
4
W
W
h
h
e
e
r
r
e
e
a
a
m
m
I
I
This function is useful for the administrator to locate the access points to build the best
signal transmitting position for multiple access points.
Available parameters are explained as follows:
Item Description
Sound
Use the drop down list to specify a special sound for such
access point.
for XX seconds
Set the duration time of the beep sound.
Sound
Activate the buzzer of the access point.
Stop
Terminate the buzzer of the access point.