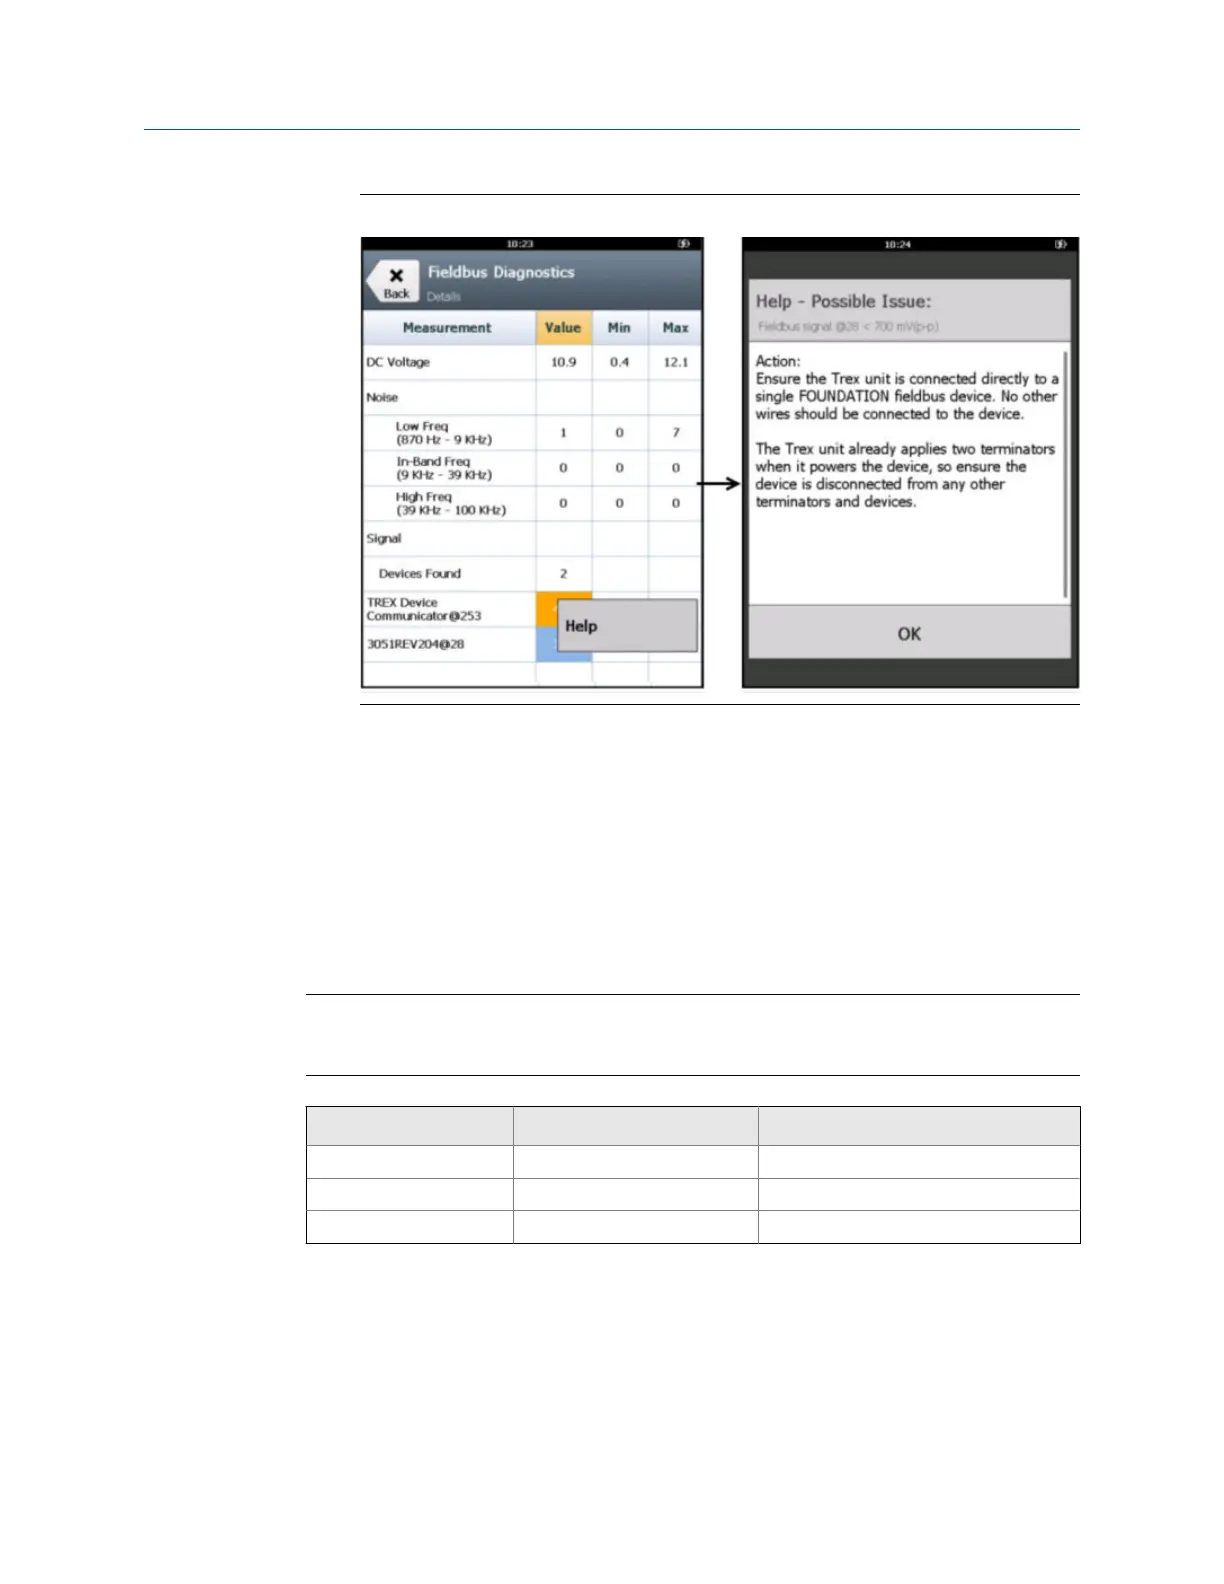
Help exampleFigure 5-7:
5. Tap OK to close the Help screen.
5.11 Noise spectrum
The noise spectrum gives you a real-time view of the different types of noise that were
detected on the fieldbus segment. Various conditions can cause different types of noise.
The spectrum displays the measurements grouped by low frequency, in-band, and high
frequency noise. The frequencies between 9 and 39 KHz make the fieldbus signal.
Note
Before taking a noise measurement, remove the AC adapter from the Trex unit, if it is connected.
This isolates the Trex unit from the local power grid.
Frequency Frequency range Typical measurement values
Low frequency 870 Hz - 9 KHz Less than1000 mV (peak-to-peak)
In-band frequency 9 KHz - 39 KHz Less than 75 mV (peak-to-peak)
High frequency 39 KHz - 100 KHz Less than 150 mV (peak-to-peak)
The gray/shaded area at the top of the noise spectrum shows the values that would exceed
the maximum values set in the measurement criteria for the low-frequency, in-band
frequency, and high-frequency measurements. If the measurement is in the gray/shaded
area, the Fieldbus Diagnostics Overview screen shows a status of CHECK. If the
measurement is below the gray/shaded area, the displayed status is GOOD.
Fieldbus Diagnostics application
162 User Guide
 Loading...