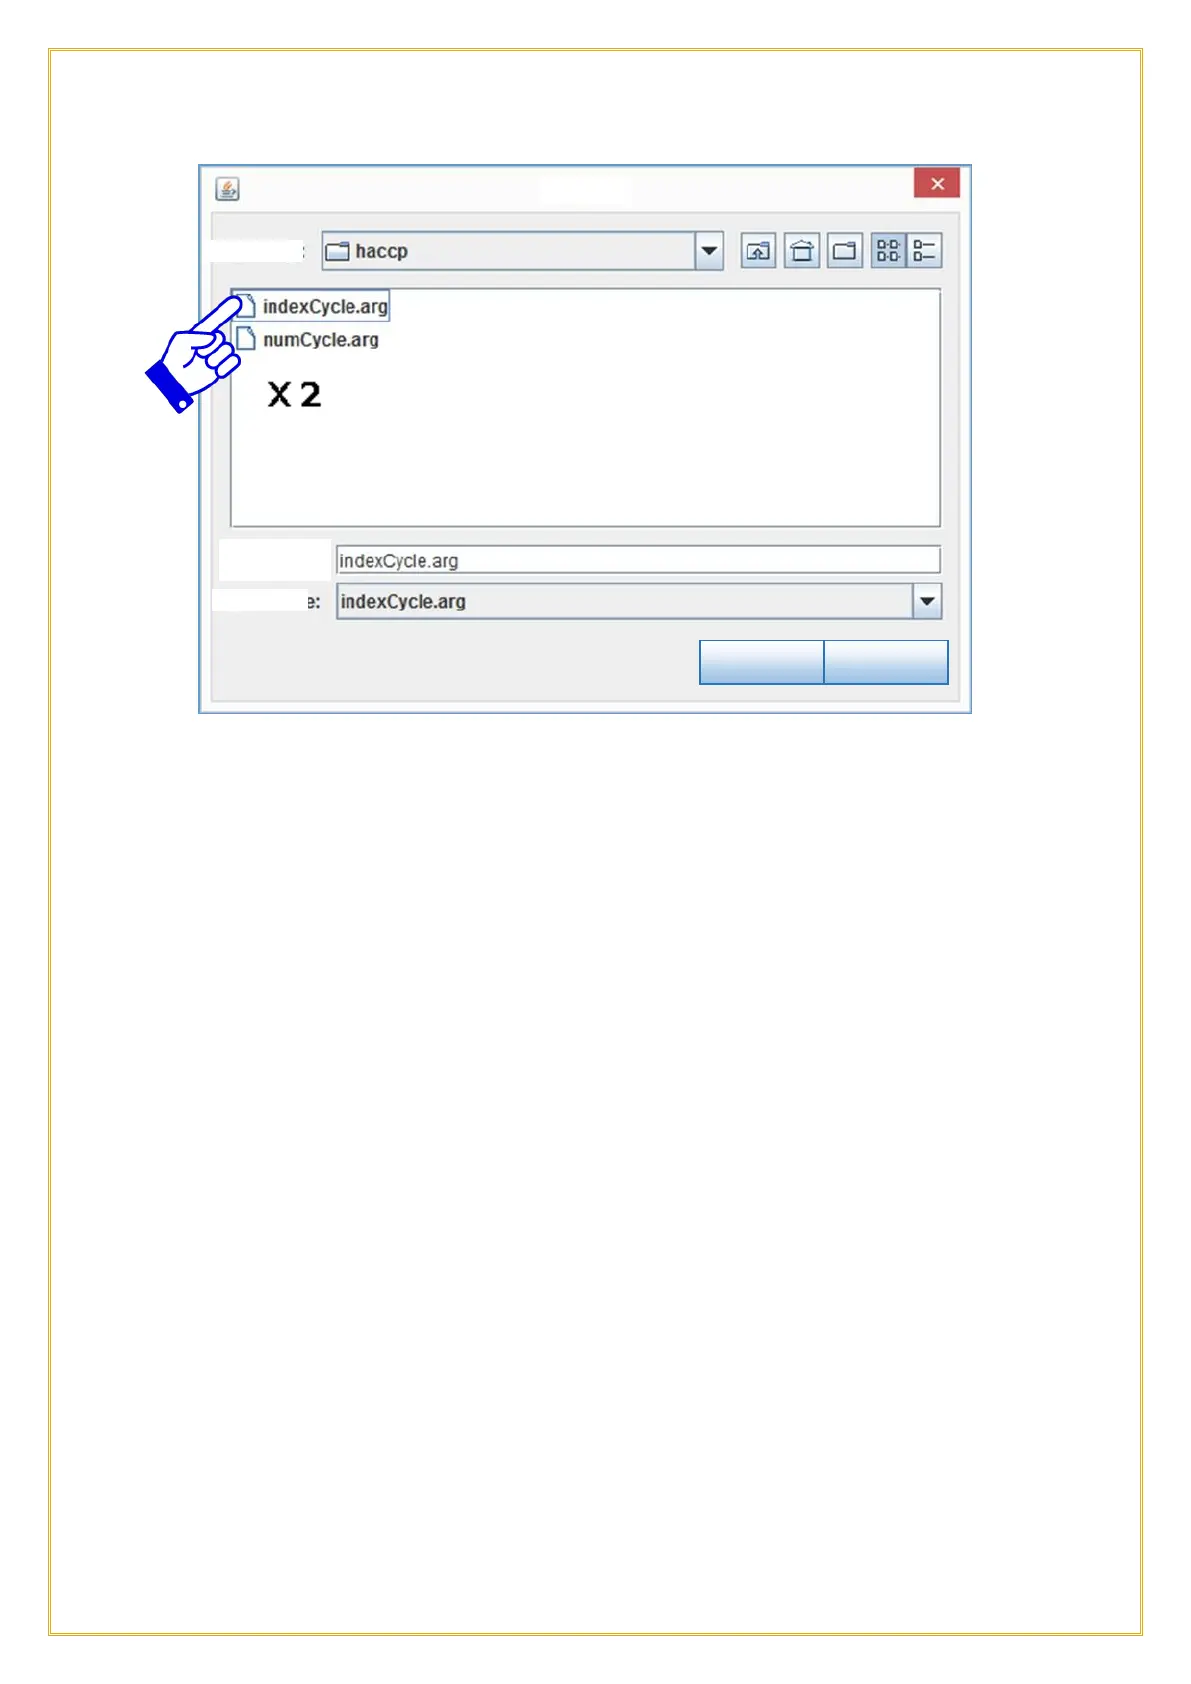
The two .arg files will now be shown in the box, double click on the indexCycle.arg
folder.
Select the cycle to graph from the right column, choosing the date, starting hour and
cycle code you wish to see (see encoding scheme above). See example of cycle graph at
the following page. Right click on the graph to print or save a .png file. Scroll up or down
to zoom in and out. To zoom in a specific area of the graph, just select the area with the
mouse.