ThermalRite Blast Chiller Easy Touch Screen Manual
process during all the cycle, with Air Temperature and Fan Speed always being the
same value.
5.4. Cycle Graph and other functions
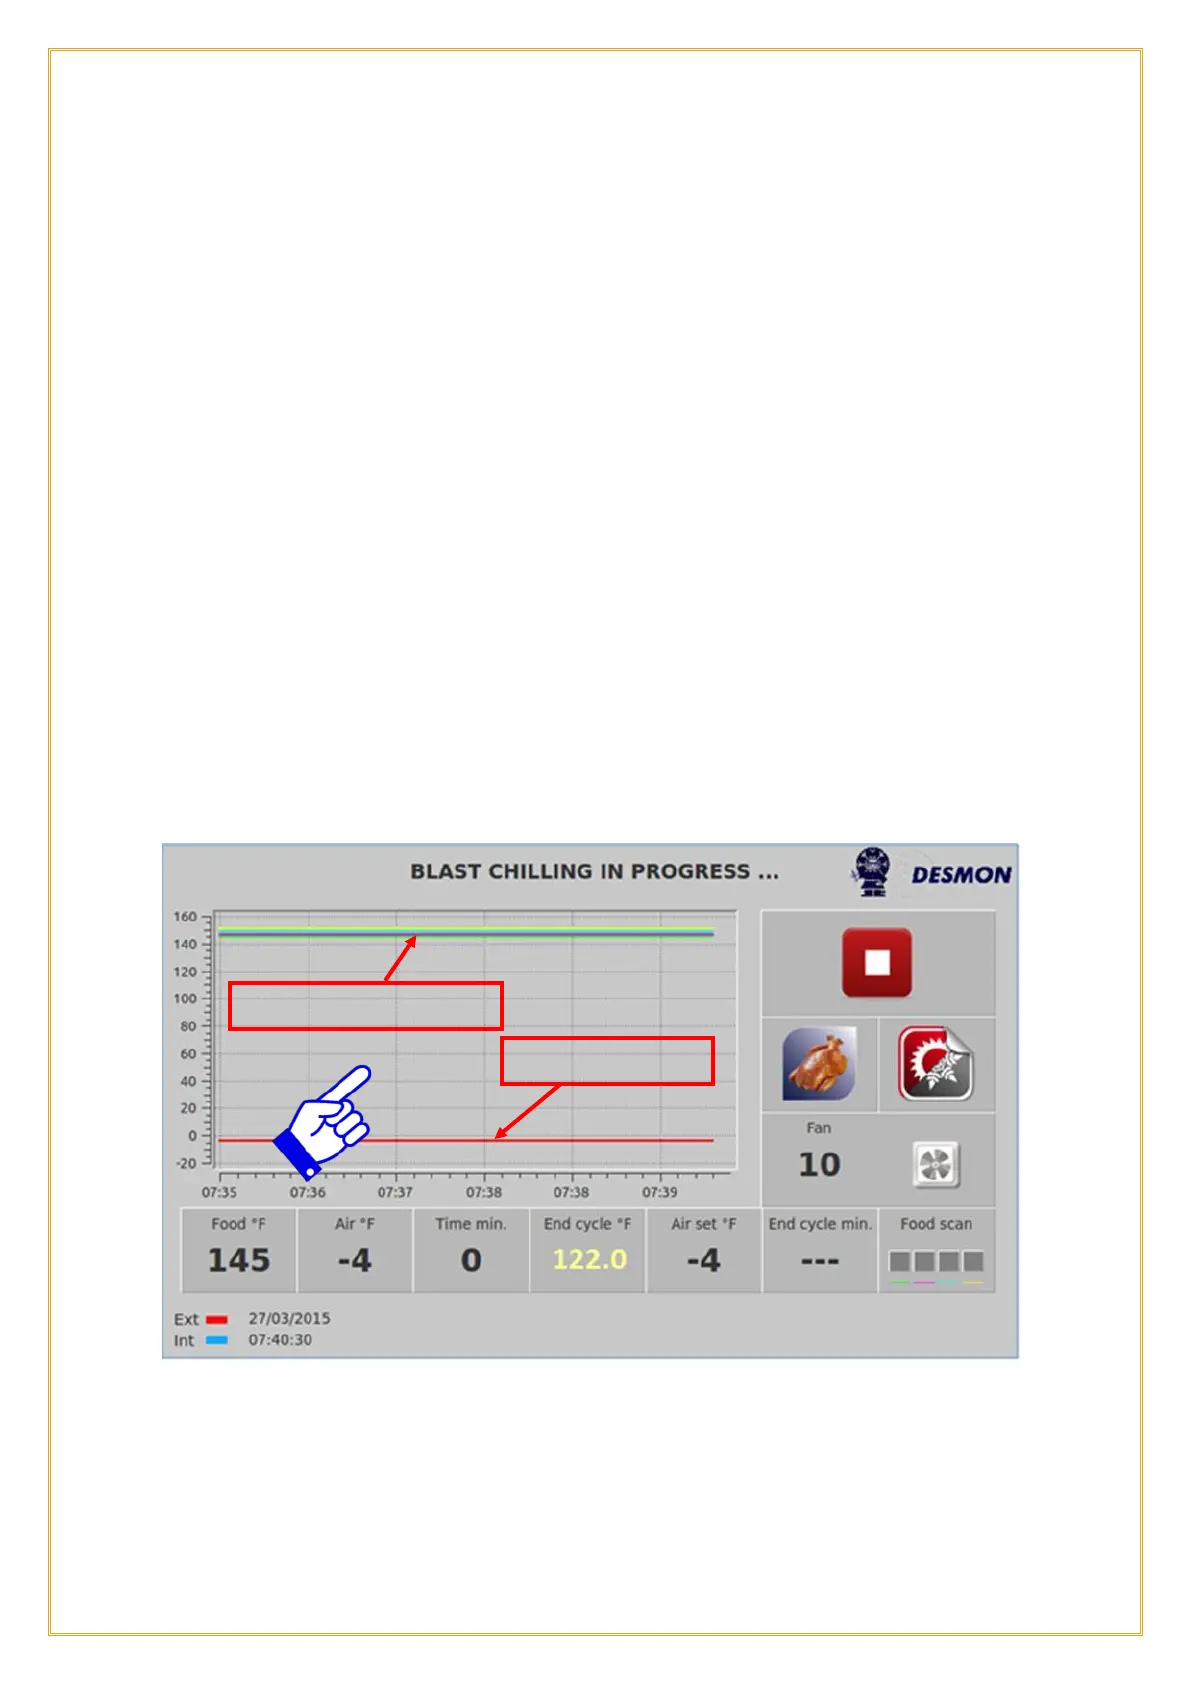
For either a Pre-programmed, Custom or Manual cycle the graph will show the Air
Set Temperature, the actual cavity Air Temperature and the Product Probe
Temperature during a Chilling or Freezing cycle. The Timer will count down until it
reaches the cycle set time or will count up, when using the Product Probe, until the food
target temperature is reached and will then switch to the Hold mode. The cycle can be
stopped at any time by pressing the Stop button. If the door(s) are opened, the fans and
compressor will turn off. The compressor has a 1-minute delay on start up.
The graph can chart the various probes and can be customized to the user’s choice. In the
example below, the 4 sensors of the Product Probe (yellow, blue, black and green) are
on the top of the graph and the evaporator sensor (red) is on the bottom of the graph.
Notice there is no End Cycle Time indicated, as the Product Probe is being used.
At any time while running a cycle, touch anywhere on the graph and this screen will
appear. It allows the user to select which temperature value will be charted in the graph
by enabling or disabling the Green Checkmarks on the left side tabs. The Product
Probe and the cavity Air Temperature Probe are enabled. Although you can chart