46
THG/TLG/TLT
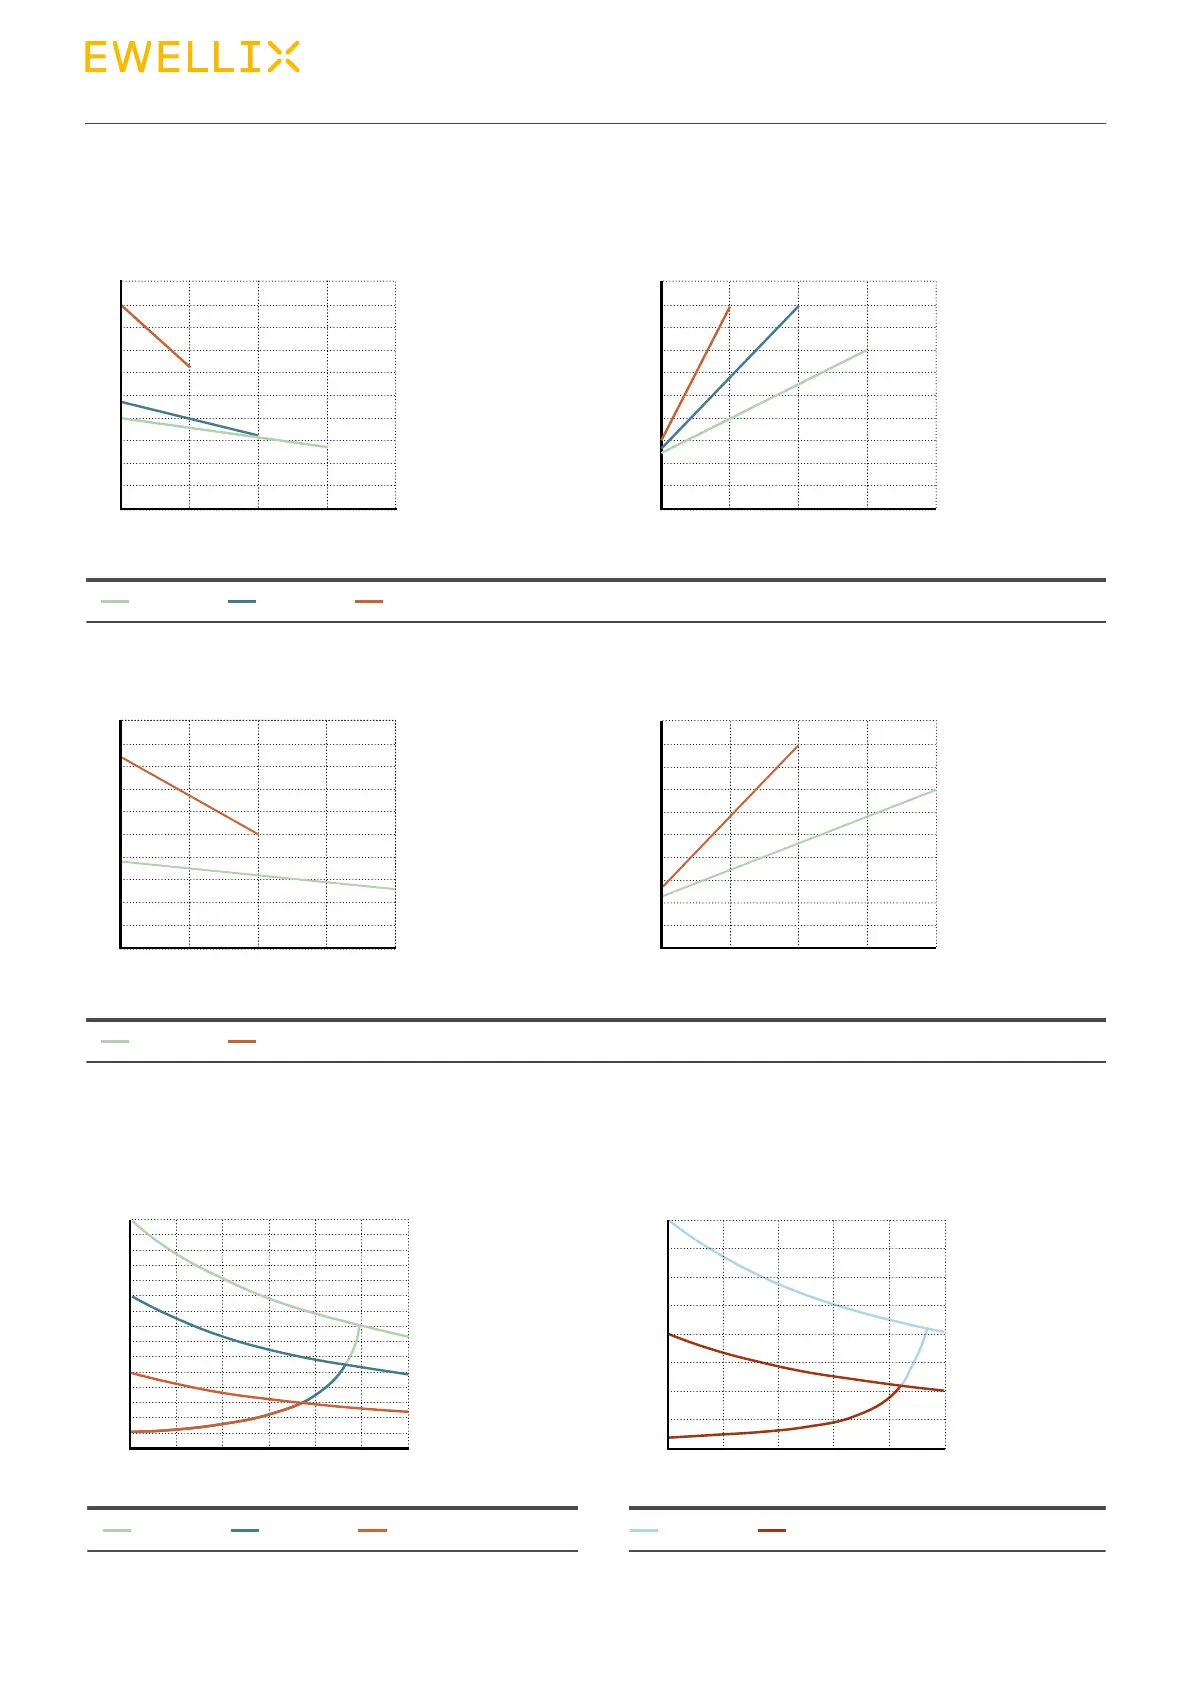
Performance diagrams
Bending load diagrams
Load [N]
Bending load diagram A1, B1, C1 Bending load diagram A2, C2
Load distance from center of pillar [mm] Load [N]
Load [N]
TLT1 A-1 TLT1 B-1 TLT1 A-2 TLT1 C-2TLT1 C-1
Overload range
Overload range
Ideal load range
Ideal load range
Under load range Under load range
0
0 50 100
200
400
3 000
150 200 300250
600
800
1 000
1 200
1 400
1 600
1 800
2 000
2 200
2 400
2 600
2 800
0
0 100
500
4 000
200 500
1 000
1 500
2 000
2 500
3 000
3 500
300 400
Speed [mm/s]
Speed-load diagram Current-load diagram
Load [N] Load [N]
Current consumption [A]
A1 B1 C1
4
0
8
12
16
20
24
28
32
36
40
0 1 000 2 000 3 000 4 000
0,5
0
1,0
1,5
2,0
2,5
3,0
3,5
4,0
4,5
5,0
0 1 000 2 000 3 000 4 000
Speed [mm/s]
Speed-load diagram Current-load diagram
Load [N] Load [N]
Current consumption [A]
A2 C2
5
0
10
15
20
25
30
35
40
45
50
0 1 000 2 000 3 000 4 000
0,5
0
1,0
1,5
2,0
2,5
3,0
3,5
4,0
4,5
5,0
0 1 000 2 000 3 000 4 000