Home Page6
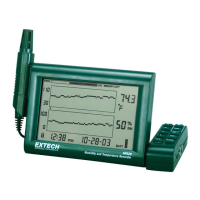
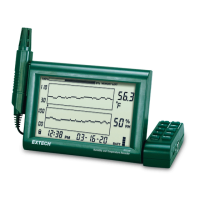
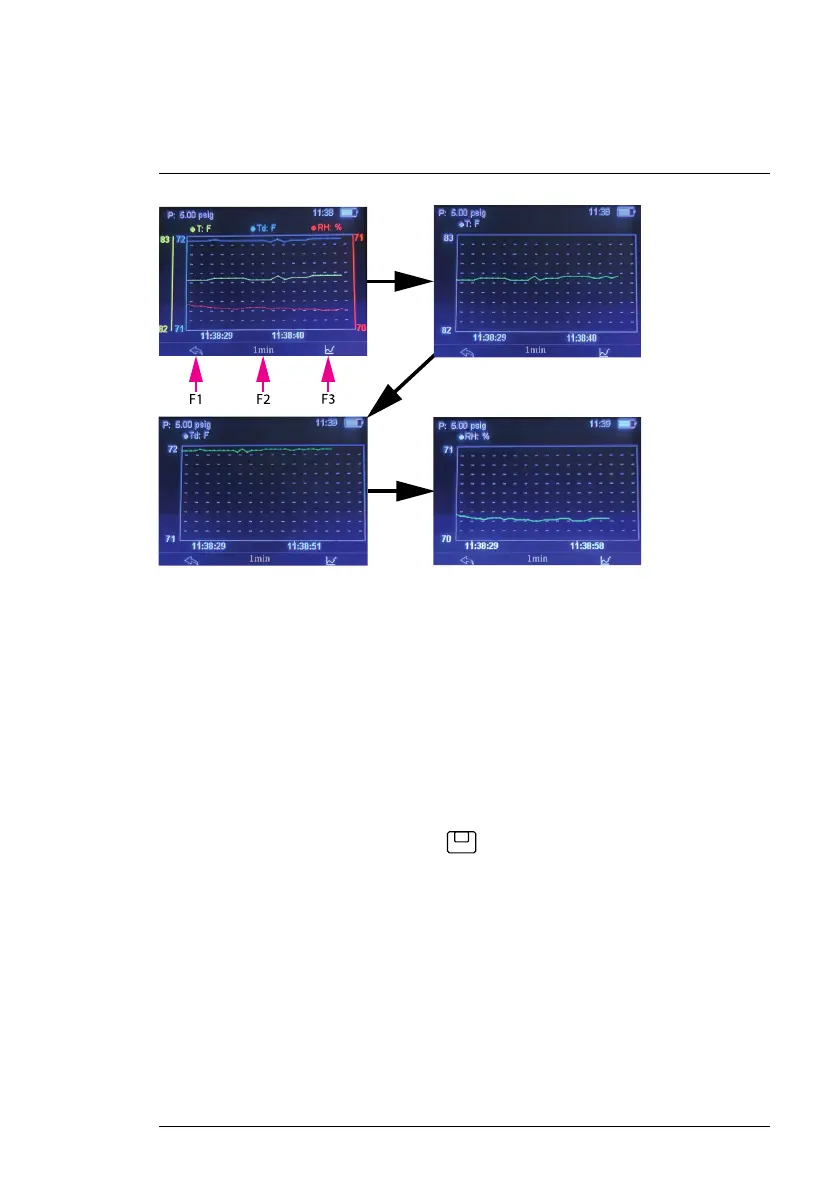
Figure 6.3 Real-time readings shown on four graphs. Press F1 from the Home Page to open
the first graph (upper left) which shows all readings on one graph. Press F3 to step through
the other graphs which show one reading per graph and then back to the first graph. Press F2
to change the sampling rate (interval between each captured reading). Press F1 to return to
the Home page.
6.4 Data Hold Mode
The Data Hold feature allows you to freeze readings on the display. The read-
ings are held on the display until you release them, as explained below.
1. From the Home page, press F2 under the word HOLD.
2. The display will show the word HOLD in red, and the readings will be
frozen.
3. To save these readings press F3
.
4. To release the readings and return to the Home page, press F1.
The readings that you save in the Data Hold mode are saved to a file named
Hold and Save in the RH600 internal flash drive for later viewing on the meter
display and for downloading to a PC. Files downloaded to a PC can be
opened in a spreadsheet for general use and for creating professional reports.
See Section 8, Data Recording, for complete information on viewing and
downloading recorded data.
#NAS100113; r. AA/87024/87024; en-US
11