Data Recording
8
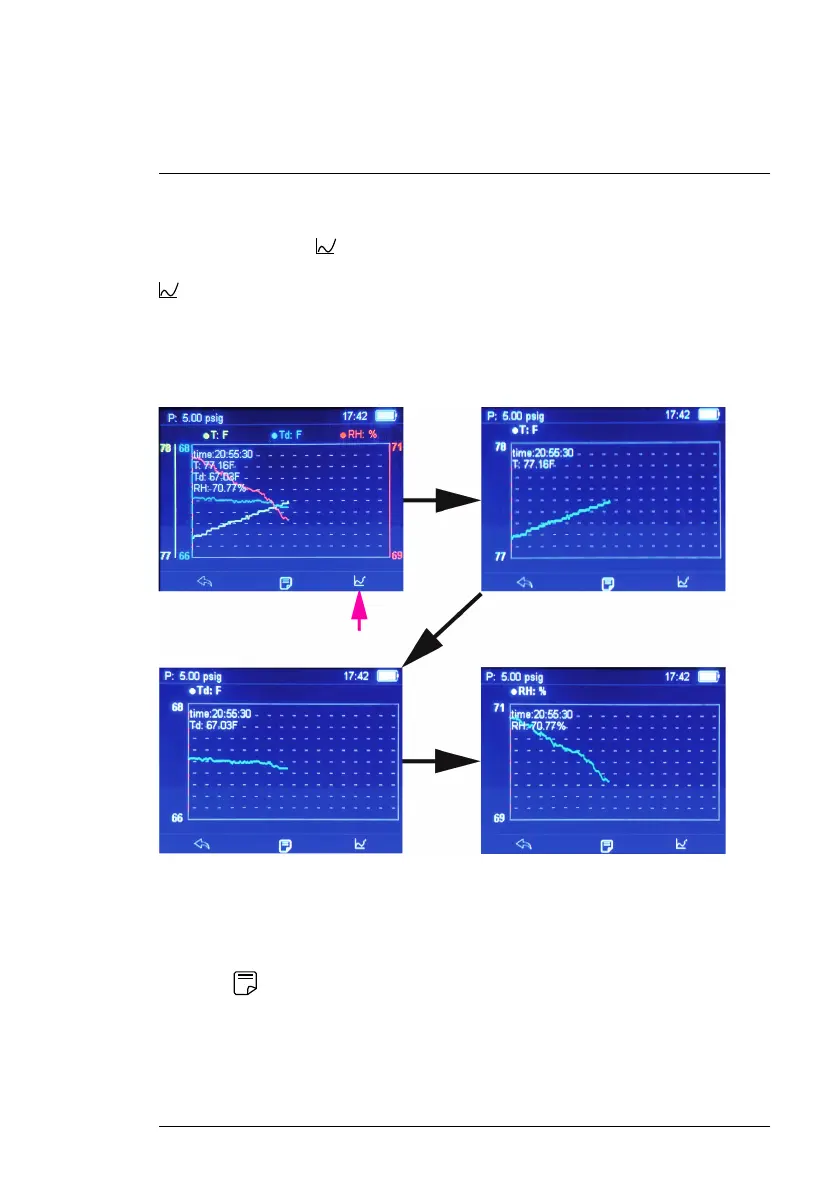
8.6 Viewing Data Files on Graphs
When you press F3
from an opened Data Log or Data Hold file, the data
are presented on graphs. Step through the set of four graphs by pressing F3
. The first graph that appears shows all readings on one graph, as shown
on the upper left screen in Figure 8.5, below. The next three graphs show
each reading represented on its own graph. Use the left and right arrow but-
tons to move the cursor along a data curve to analyze individual measurement
points.
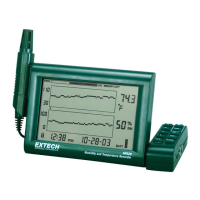
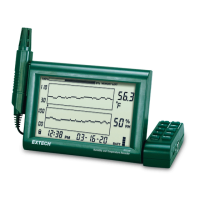
Figure 8.5 Graphical representations of recorded data. Press F3 in an opened data file to
step through the four graphs. The first graph (upper left), shows all the data on one graph, the
second screen (upper right) shows only the Temperature data, the next two screens show the
user-selected readings. In this example, dew point and relative humidity. Use the left/right ar-
row buttons to move the cursor along a curve to analyze individual measurement points.
Press F2 , from a graph page, to show a summary of the data file, as
shown below in Figure 8.6.
#NAS100113; r. AA/87024/87024; en-US
21