Descriptions
2
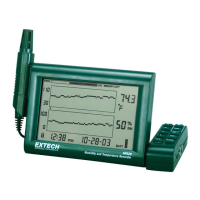
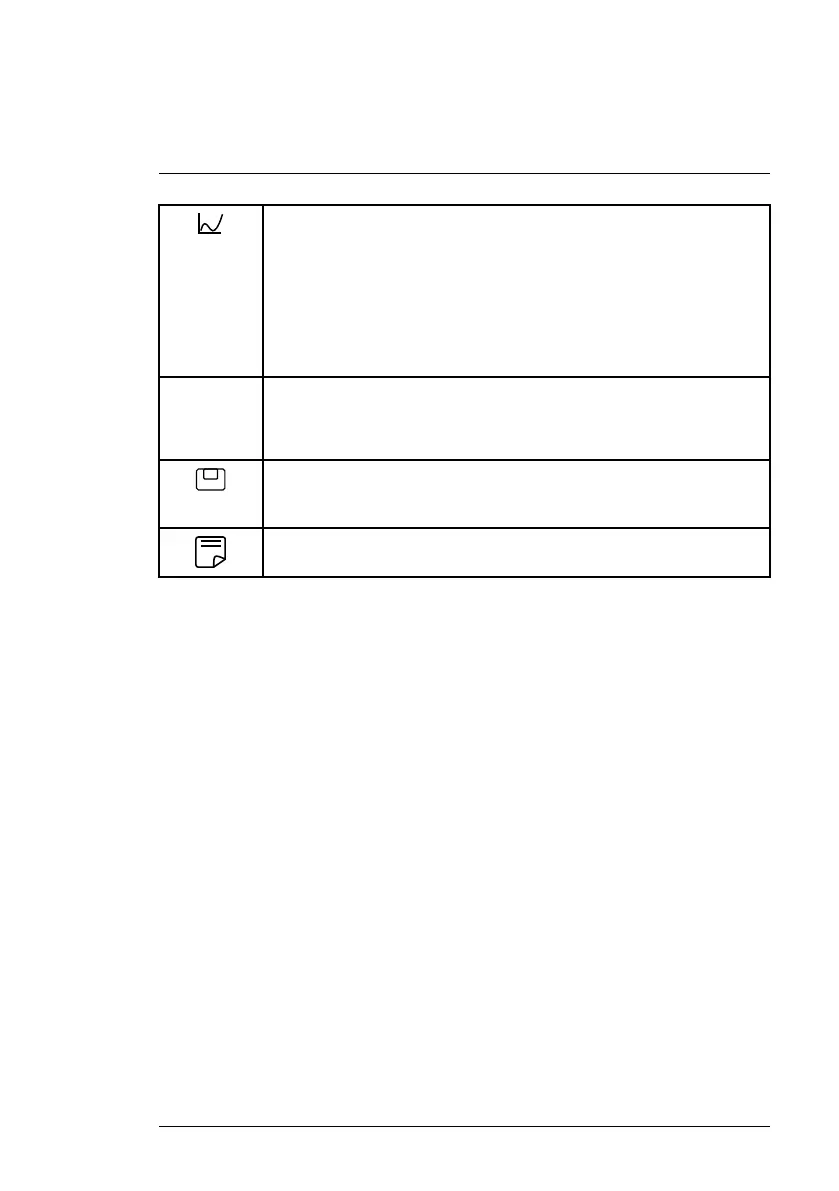
From the Home page (Section 6), press F1 to begin viewing real-time
readings plotted on graphs. When the first graph opens, this icon will move
to the area above F3, press F3 at that point to step through all the available
graphs.
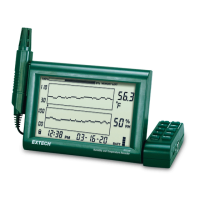
When you select View Data File from the Recording menu, and then open
a Data Log or a Data Hold file, press F3 to step through the four graphs
that represent the saved readings. See Section 8, Data Recording, for
specifics.
1S, 1min When viewing real-time readings plotted on a graph, as explained directly
above and in Section 6, press F2 to set the sampling rate (interval of time
between readings). The options are 1, 5 or 30 seconds and 1, 5, or 10
minutes.
Press F3 to save the readings that are held while the Data Hold function is
engaged. See Section 6.4, Data Hold, and Section 8, Data Recording, for
complete details.
Press F2 to view a Data Log file or a Data Hold file as a summary page.
See Section 8, Data Recording, for details.
#NAS100113; r. AA/87024/87024; en-US
4