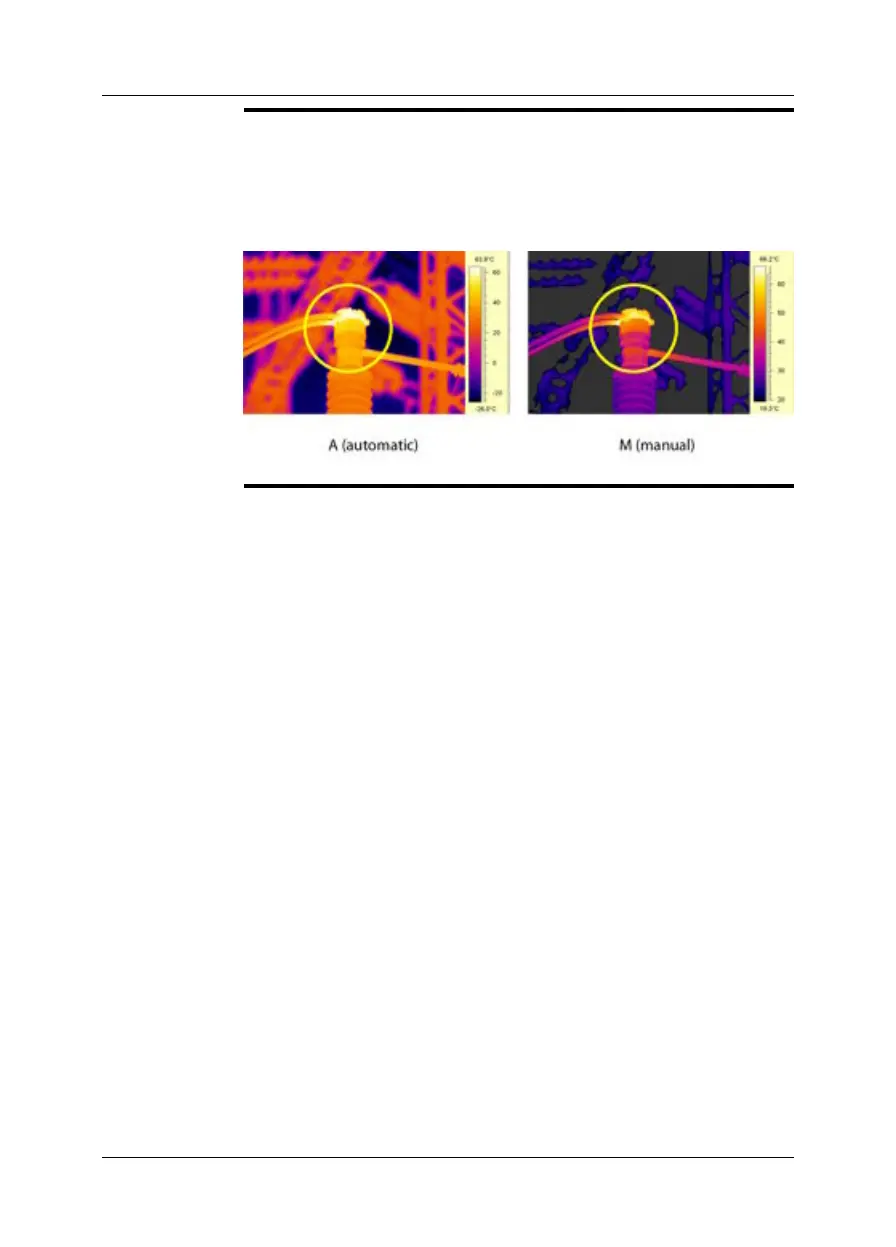
Example 2
This figure shows two infrared images of an isolator in a power line.
In the image on the left the cold sky and the power line structure have been recorded
at a minimum temperature of –26.0°C (–14.8°F). In the right image the maximum and
minimum temperature levels have been changed to temperature levels near the iso-
lator. This makes it easier to analyze the temperature variations in the isolator.
10742503;a3
34 Publ. No. T559597 Rev. a554 – ENGLISH (EN) – September 27, 2011
15 – Working with images