Scan/Monitor, Record, and Data
Scan 4
4-13
hcn061.eps
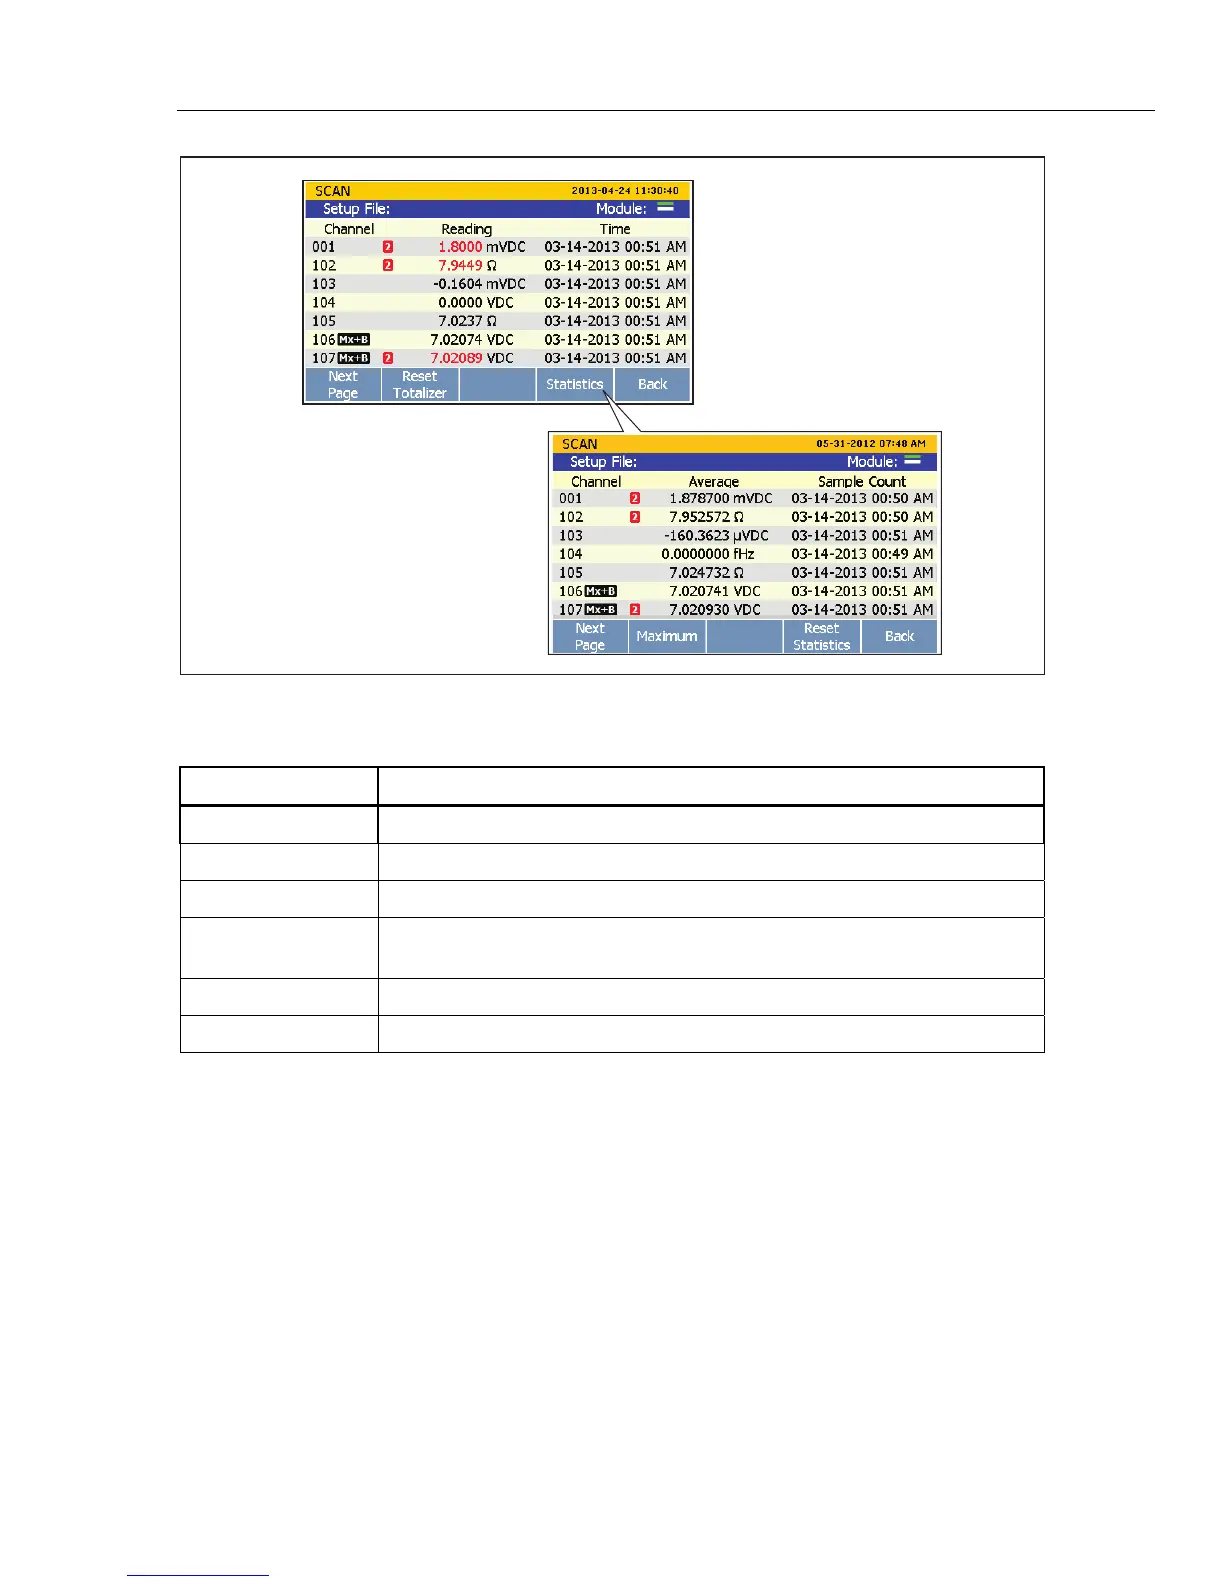
Figure 4-4. Scan Data
Table 4-3. Scan Statistics
Statistic Description
Maximum Maximum measurement.
Minimum Minimum measurement.
Average Average of all the measurements taken.
Standard Deviation
A measure of the distribution of a set of data from its mean. The more spread
apart the data, the higher the deviation.
Peak-to-Peak Difference between the Maximum and the Minimum.
Rate of Change A measure of how much the readings change over time.
To view the scan data:
1. Start a scan. See “Start a Scan” on page 4-11.
2. Push to open the Scan Data menu. After the menu opens, push to cycle the menu
pages to view more channels.
3. To view channel statistics, push .
4. To cycle through the available statistical values, push .