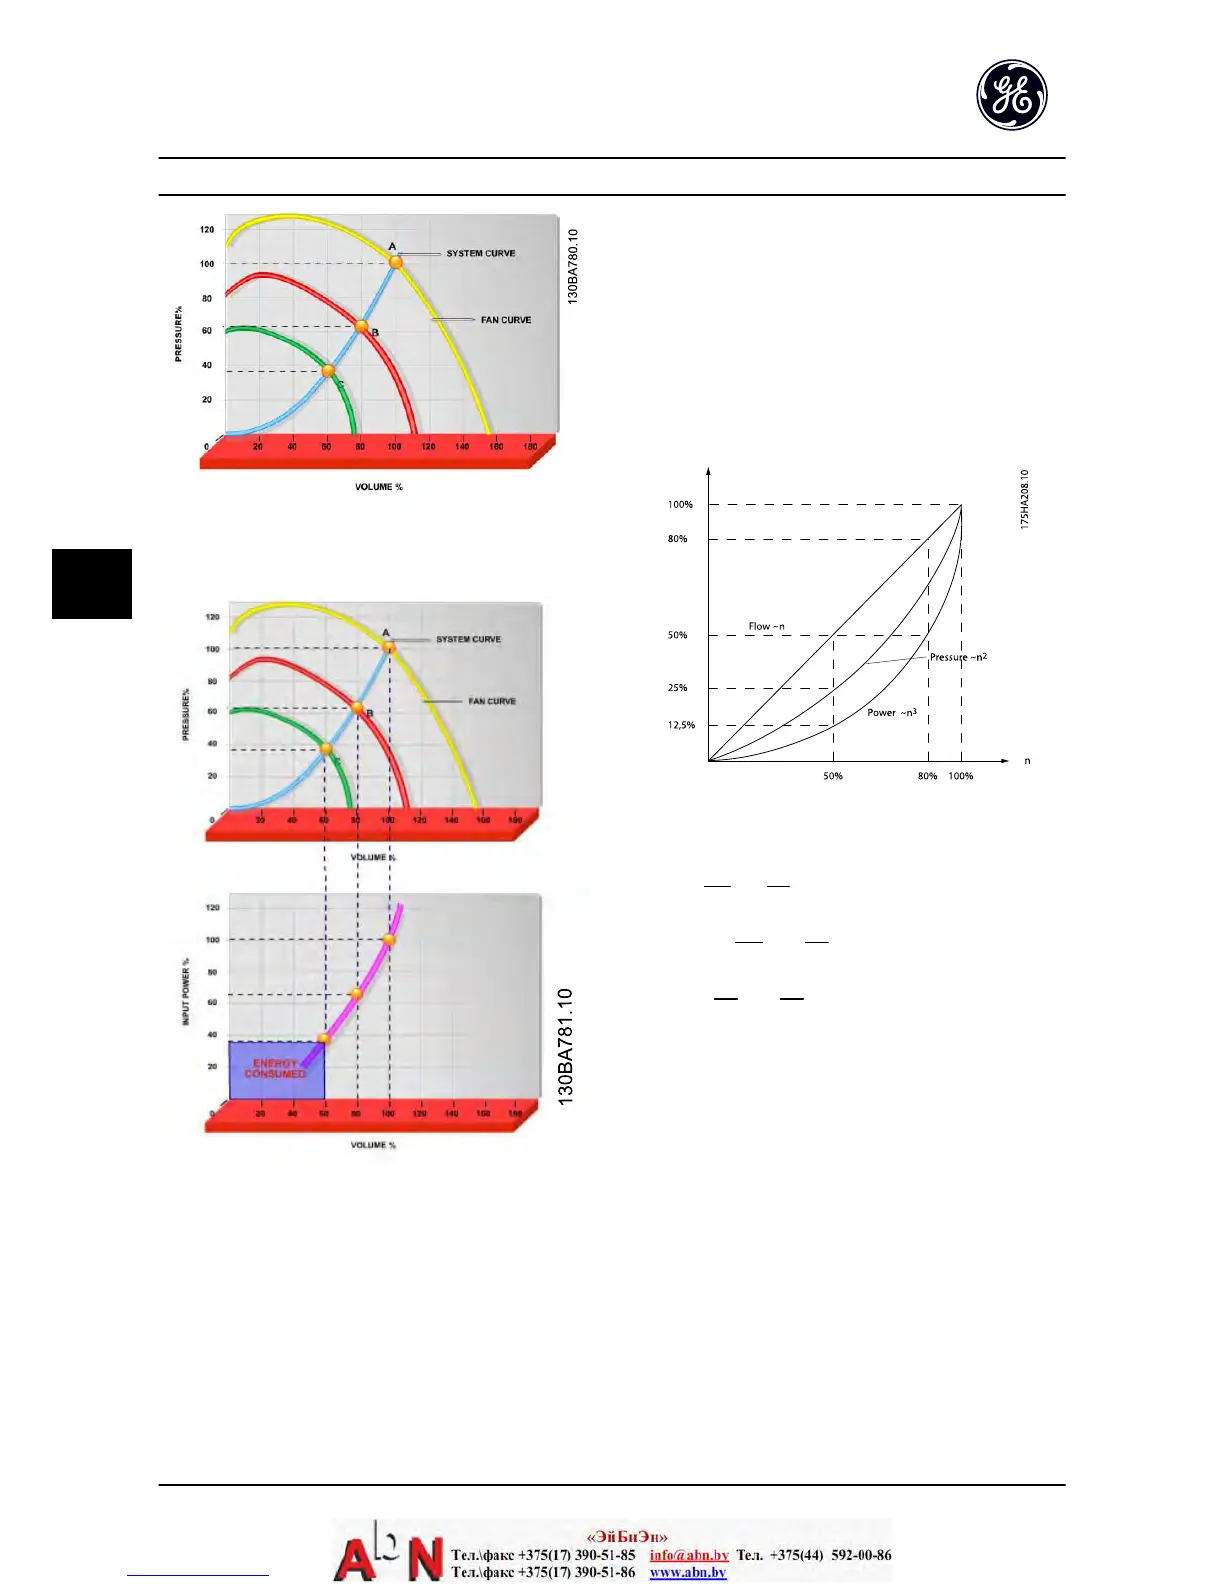
Figure 6.4 The graph is showing fan curves (A, B and C) for
reduced fan volumes.
Figure 6.5 When using a adjustable frequency drive to reduce
fan capacity to 60%, more than 50% energy savings may be
obtained in typical applications.
6.3.3 Example of Energy Savings
As can be seen from the figure (the laws of propor-
tionality), the flow is controlled by changing the RPM. By
reducing the rated speed by only 20%, the flow is also
reduced by 20%. This is because the flow is directly
proportional to the RPM. The consumption of electricity,
however, is reduced by 50%.
If the system in question only needs to be able to supply a
flow corresponding to 100% a few days each year, while
the average is below 80% of the rated flow for the
remainder of the year, the amount of energy saved is even
greater than 50%.
Figure 6.6 describes the dependency of flow, pressure and
power consumption on RPM.
Figure 6.6 The laws of proportionality
Flow
:
Q
1
Q
2
=
n
1
n
2
Pressure
:
H
1
H
2
=
(
n
1
n
2
)
2
Power
:
P
1
P
2
=
(
n
1
n
2
)
3
Q = Flow
Q
1
= Rated flow
Q
2
= Reduced flow
H = Pressure
H
1
= Rated pressure
H
2
= Reduced pressure
P = Power
P
1
= Rated power
P
2
= Reduced power
n = Speed regulation
n
1
= Rated speed
n
2
= Reduced speed
Application Set-up Examples AF-600 FP Design and Installation Guide
6-6 DET-768A
6
 Loading...