CB Watch 3 User Manual v6.3 - May 2019 Page 44 of 100
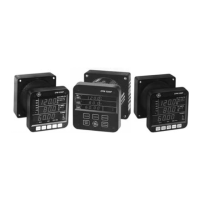
If not enough data is available to fill the short term or long term horizon set, then the
value cannot be calculated and a “-“ is displayed instead.
HMI: Measurements/Gas
Figure 61 – Gas leak rates (ganged CB)
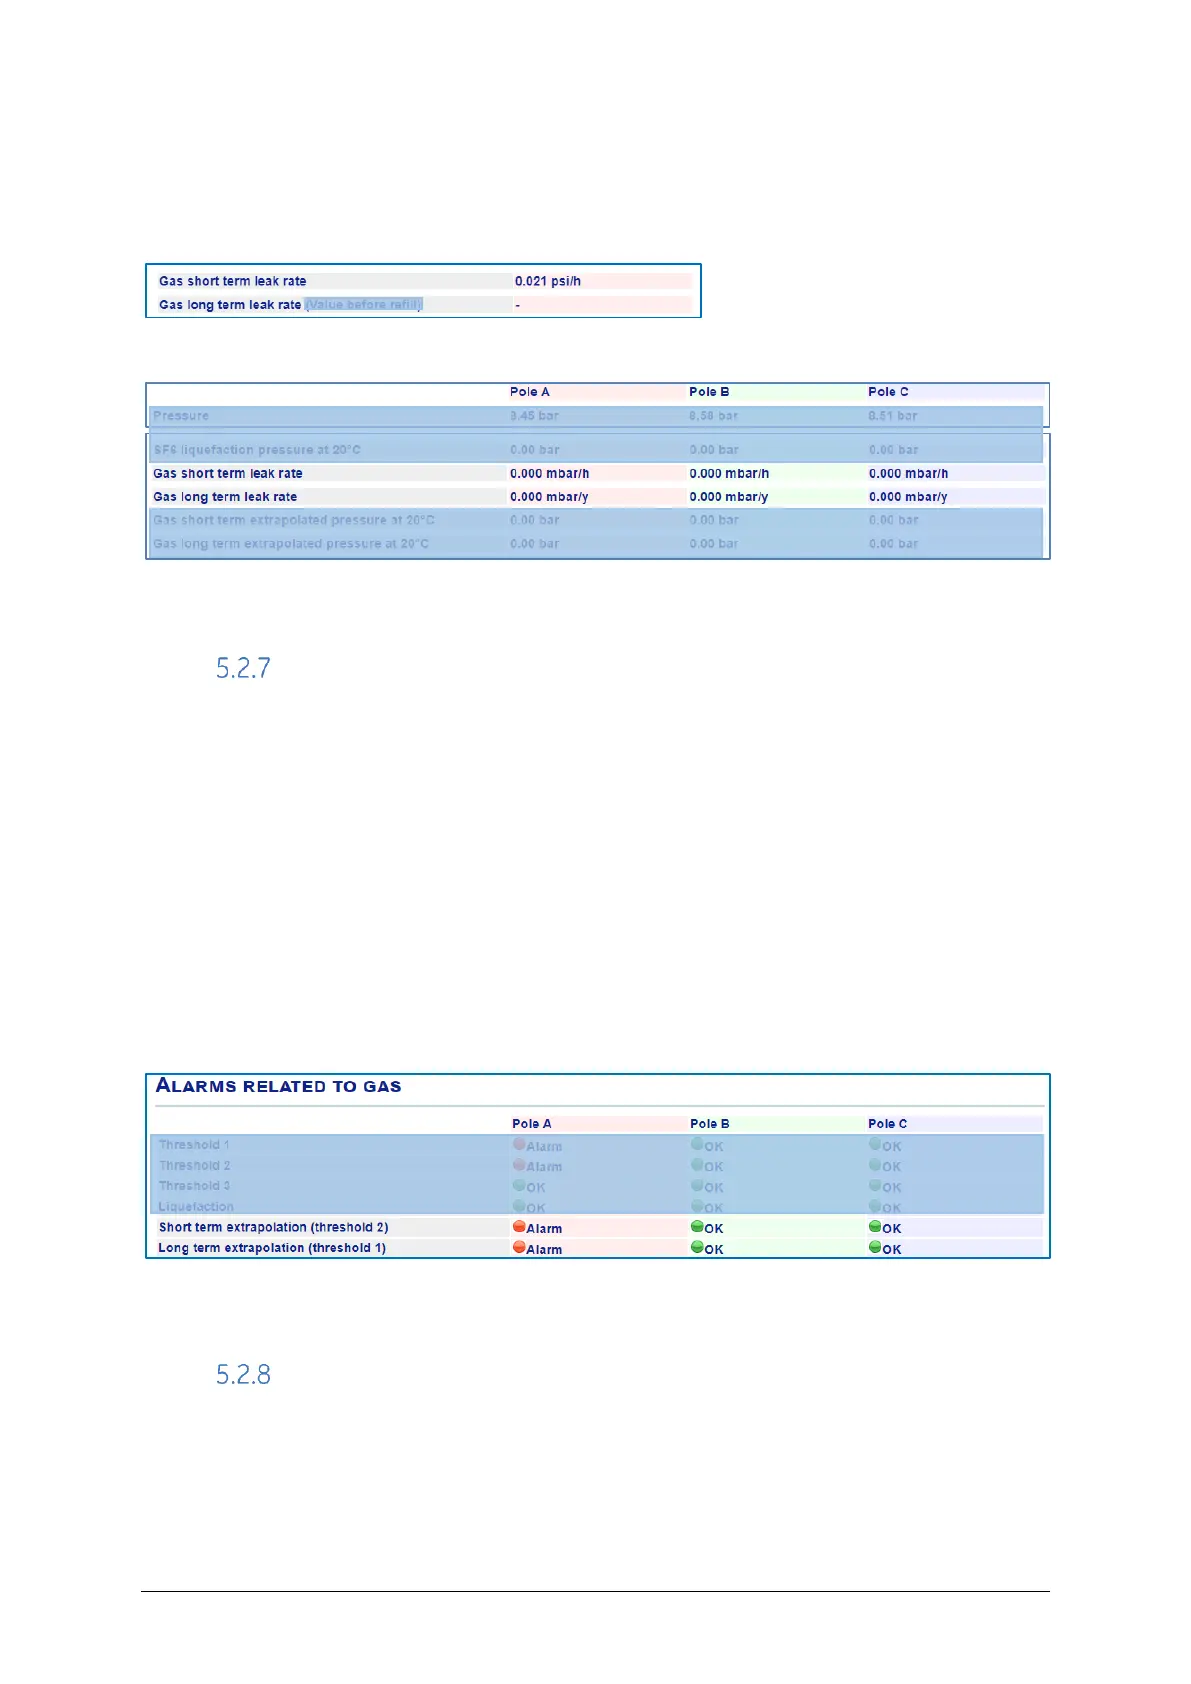
Figure 62 – Gas leak rates (IPO CB)
Gas alarms
Two alarms can be set on the extrapolated gas pressure values calculated. They rely on
the thresholds set in section 5.2.2 above:
• The “long-term” alarm is raised if the extrapolated gas pressure at 20
o
C is
calculated to drop below the gas threshold 1 (nearly too low) that has been set
➢ This means that the gas pressure/level will be below threshold 1 within the
long-term horizon that has been set
• The “short-term” alarm is raised if the extrapolated gas pressure at 20
o
C is
calculated to drop below the gas threshold 2 (too low, lock-out) that has been set
➢ This means that the gas pressure/level will be below threshold 2 within the
short-term horizon that has been set
HMI: Measurements/Alarms
Figure 63 – Gas alarms
Gas measurement history
On the HMI, you can view graphs displaying the history of the key gas parameters. Using
the drop down menu, you can select either:
• Short term graphs: with resolution of 1 value every 10 minutes
• Long term graphs: with resolution of 1 value per day
 Loading...