March 2008
2-6 Displaying Data
Using the GRAPH Format
(cont.)
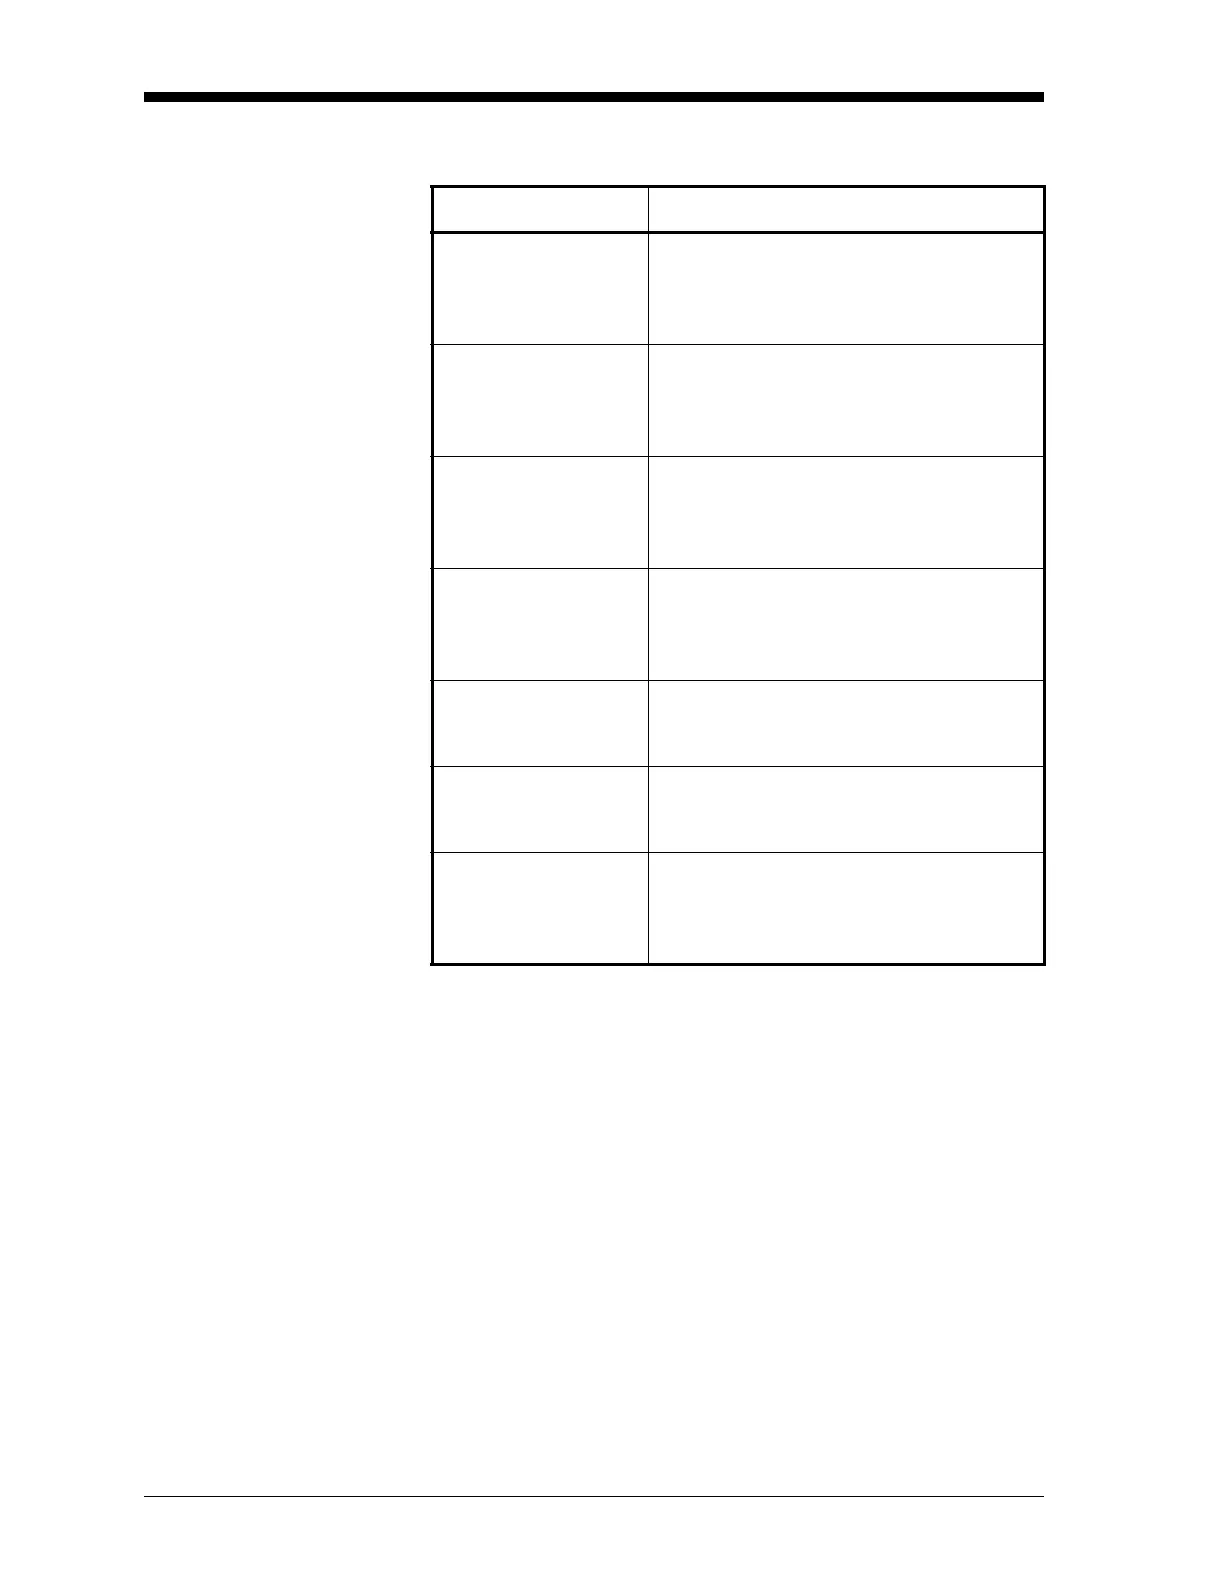
Table 2-2: Graph Display Options
Option Bar Choice Description
[F1] = <CURS Moves the cursor to the left and displays
the corresponding measurement value
and time in the status line:
(i.e.
6.85 Ft/s 10:38)
[F2] = CURS> Moves the cursor to the right and dis-
plays the corresponding measurement
value and time in the status line:
(i.e.
5.31 Ft/s 10:38)
[F3] = START Moves the cursor all the way to the left
side of the graph and posts the starting
date and time in the message line:
(i.e.
ST: 08 MAR 10:38)
[F4] = END Moves the cursor all the way to the right
side of the graph and posts the ending
date and time in the message line:
(i.e.
END 08 MAR 11:14)
[→] + [F1] = YMAX Displays the programmed maximum Y
value in the message line:
(i.e.
YMAX 25.0 Ft/s)
[→] + [F2] = T INC Displays the programmed time incre-
ment value in the message line:
(i.e.
T INC 30 seconds)
[→] + [F3] = EXIT Leaves the GRAPH format and returns the
display to the previous data format. (The
[EXIT] key on the keypad will also perform
this function.)