Displaying Data 2-9
March 2008
Graphical Format After choosing PLOT at the FORMAT prompt, the programming
sequence continues as follows:
5. Enter a maximum value for the Y-axis (vertical) scale that is larger
than the maximum expected reading and press
[ENT].
6. At the Y-Range prompt, press
[F1] to graph only positive Y values
or press
[F2] to graph both positive and negative Y values.
After the
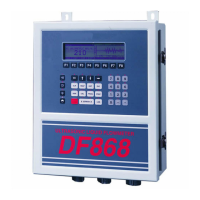
Y RANGE is entered, the Model DF868 automatically
displays the chosen log file records in the specified graphical format.
At any given time, the 120 records stored in one page of the log file
will be graphed on the display screen. The cursor, which is shown as
a vertical line that extends the full height of the graph window, can be
used to highlight any one of these records.
IMPORTANT: Only the first of the three logged parameters is
displayed in the graphical format of the
LOG
submenu. Therefore, when creating a log file, be sure
to specify the parameter to be graphed at the
1st
Value Logged
prompt. See Chapter 3, Logging Data,
for details on creating a log file.
Because the times displayed in the
LOG graph are in whole minutes
only, movement of the cursor may not result in a visible change in the
posted times. For example, if a
TIME INCREMENT of 30 seconds has
been programmed, two presses of either cursor movement key will be
required to change the displayed time by one minute.
1.23 Ft/s 10:16 ‰
Use the [←], [→] and [F1]-[F4]
keys to select the desired option.
The options are listed in
Table 2-4 on page 2-10.
V
E
L
ST: 08 MAR 09:50
<CURS CURS> START END