Printing Data 4-5
March 2008
Graphical Format To print live data in graphical format, continue as follows:
8. Use the [←], [→] and
[F1]-[F4] keys to select the first parameter to
be printed. See Table 4-2 on page 4-3 for a list of the available
options.
9. Enter the desired maximum value for the Y (vertical) axis and
press
[ENT].
Note: Enter a
Y AXIS MAX value that is larger than the largest
expected measurement value.
10.Press
[F1] to show only the positive Y axis or press [F2] to display
both the positive and negative y axis.
11. Use the [←], [→] and
[F1]-[F4] keys to select the desired Time
Increment (the frequency at which measurements are taken). The
available options at this prompt are: 5sec, 10sec, 30sec, 1min,
3min, 6min and 12min.
After the time increment is chosen, the Model DF868 returns to the
standard data display screen and continues to take measurements. The
live data is printed at the specified time intervals, until a
STOP
command is issued (see the instructions for the
STOP submenu on
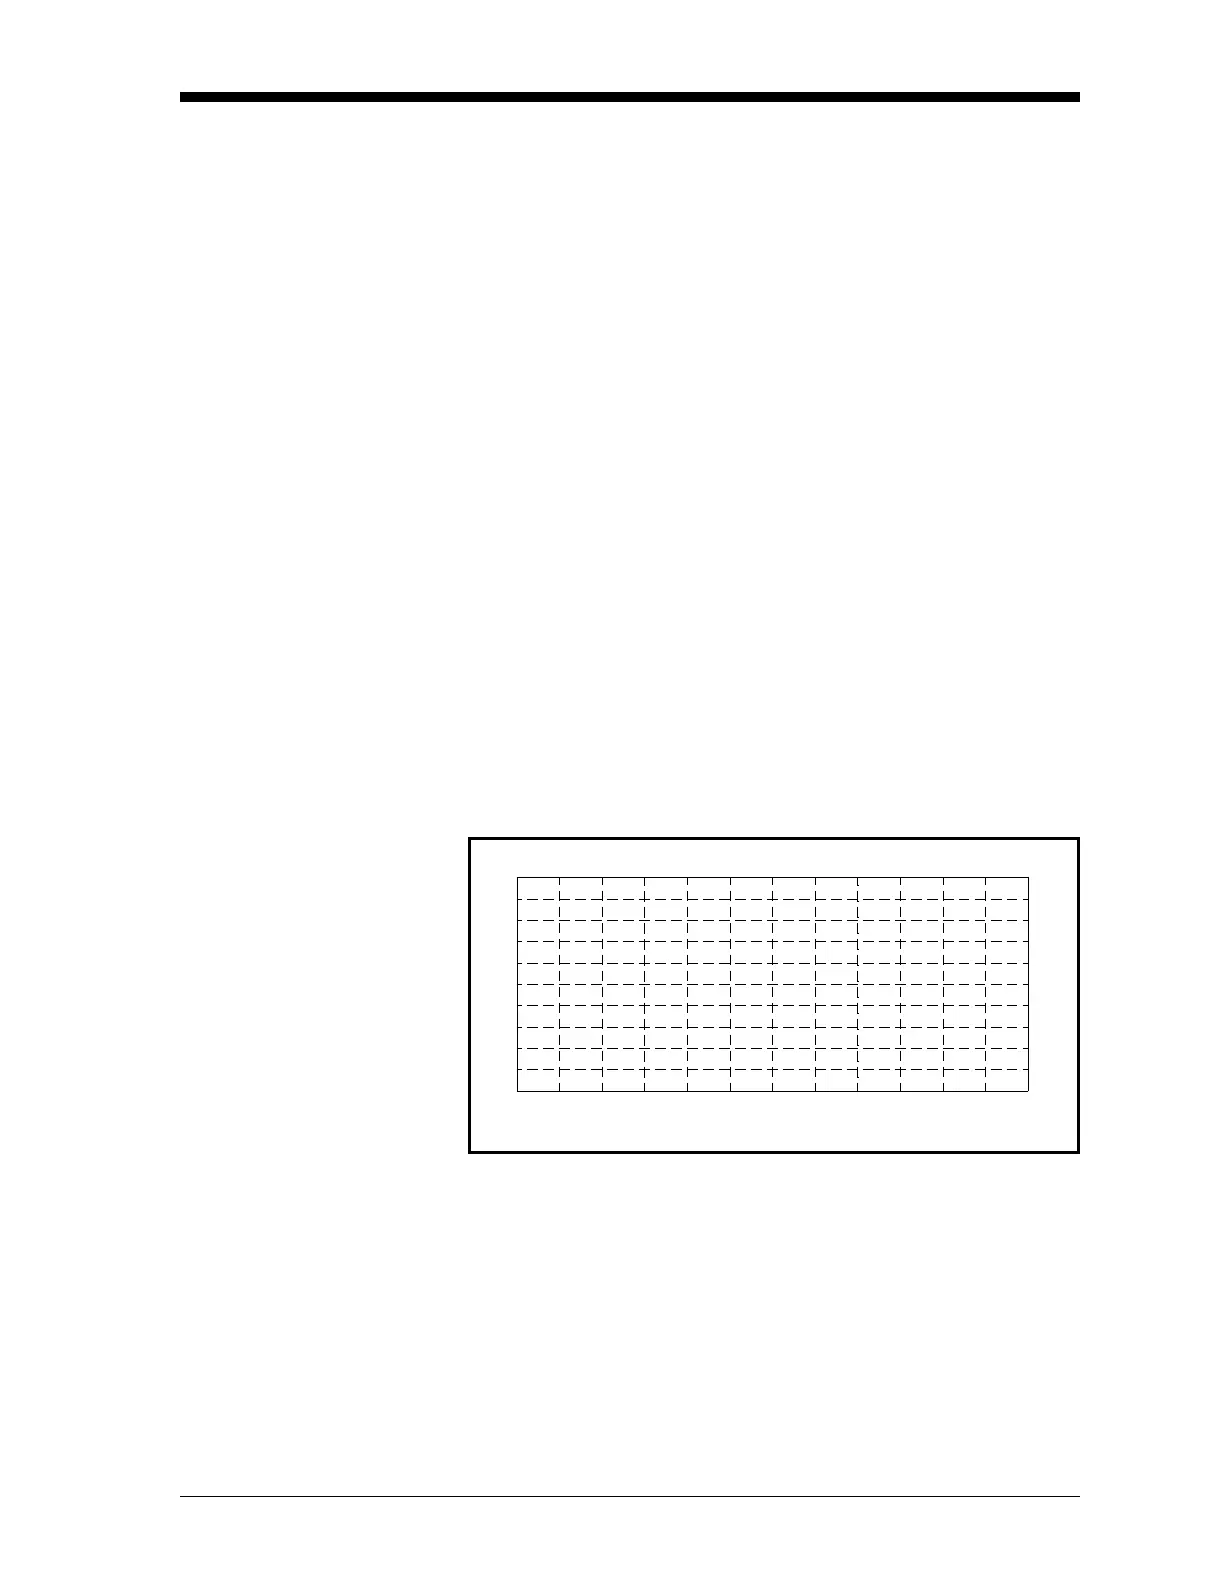
page 4-9). A portion of a typical printout is shown in Figure 4-2
below.
Figure 4-2: A Typical Graphical Printout
0.0
.1
.2
.3
.4
.5
.6
.7
.8
.9
1.0
0.0
.1
.2
.4
.3
.5
.7
.6
.8
.9
1.0
CHANNEL NAME
CHANNEL MESSAGE
X-AXIS 50 seconds PER-DIV
Y-AXIS MAX 500 ACF/M
START TIME
03:27:01 PM
20 OCT 97
END TIME
03:28:46 PM
20 OCT 97