March 2008
2-10 Displaying Data
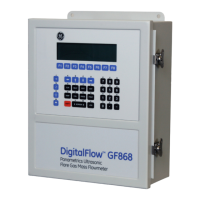
Graphical Format (cont.)
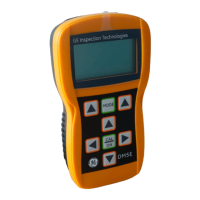
In the typical graphical display shown, the first logged parameter (VEL)
is shown to the left of the y-axis and there is a message line below the
graph that initially indicates the starting date and time of the current
page. Notice that most of the locator bar has been replaced by a status
line in standard video that shows the value, units and time of the
record at the current cursor location. However, there is still an inverse
video pointer at the far right of this line to indicate that additional
option bar choices are available.
Note: The date in the message line includes only the day and the
month (not the year), and the times in the status line and the
message line include only the hours and minutes.
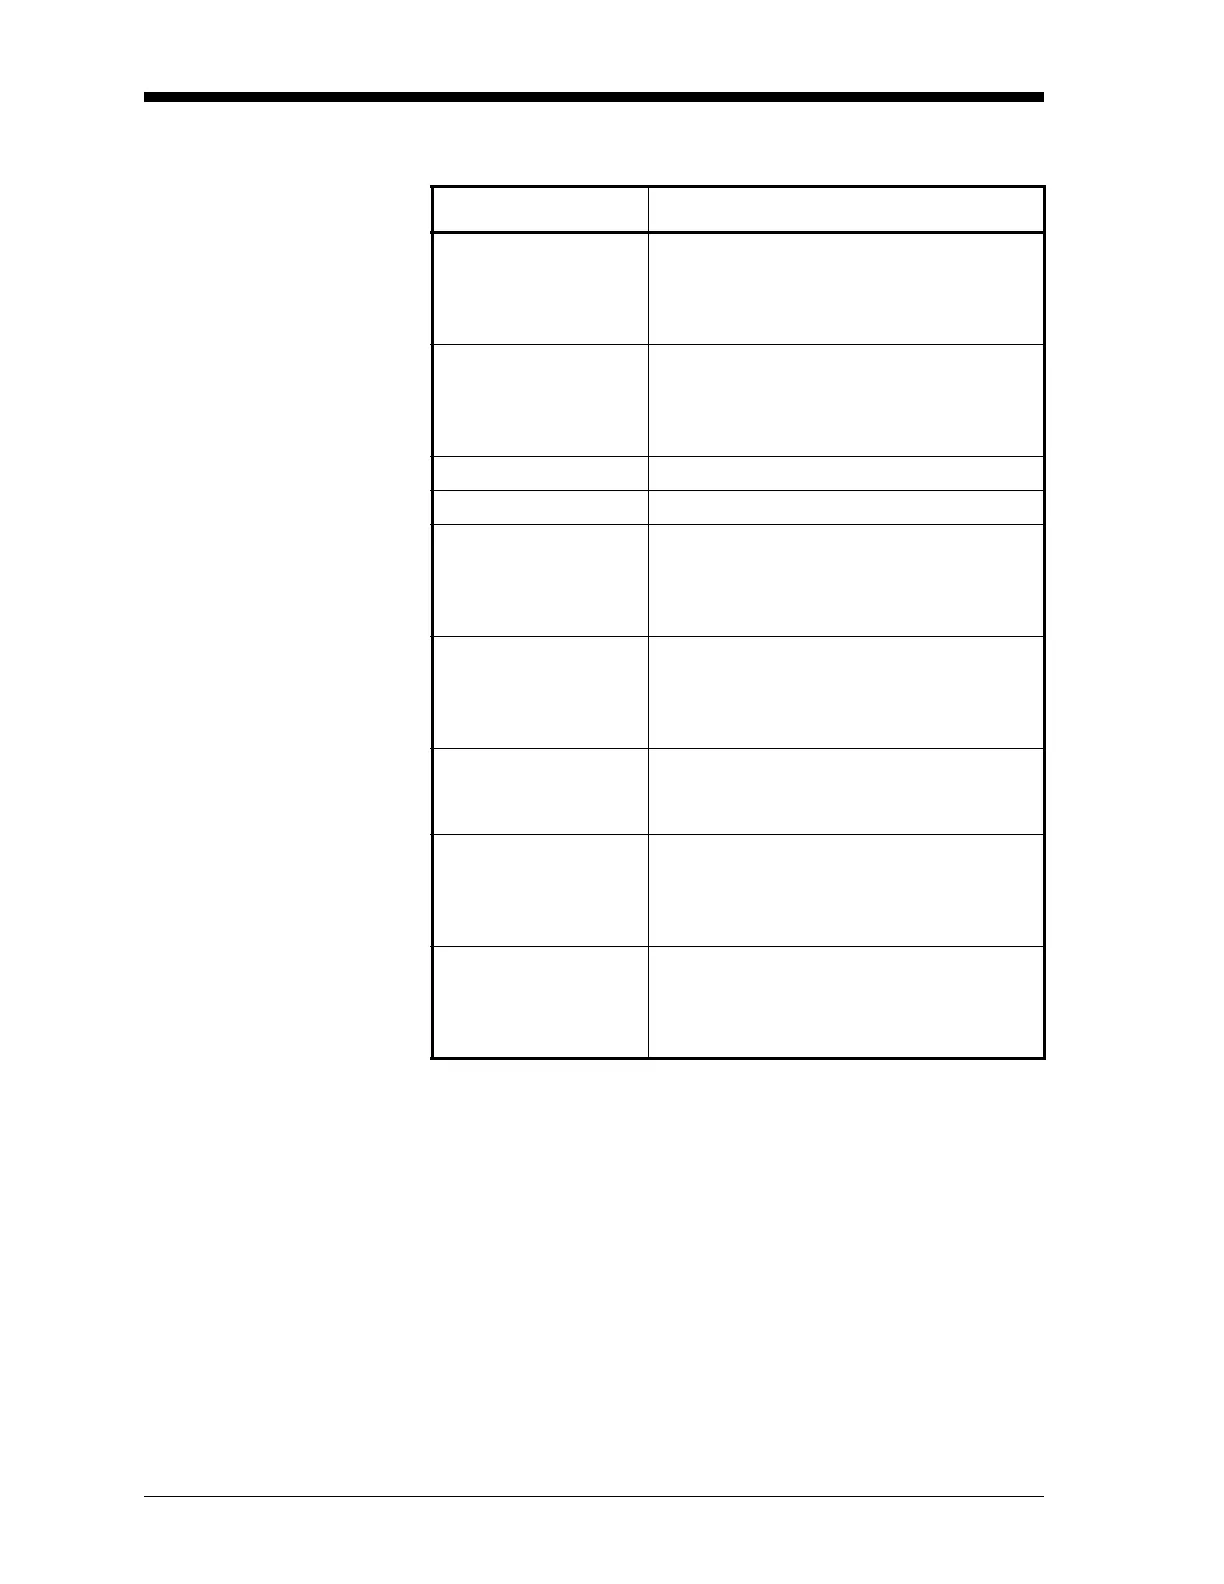
Table 2-4: Graphical Log Display Options
Option Bar Choice Description
[F1] = <CURS Move the cursor one record to the left
and display the value and time of that
record in the status line:
(i.e.
6.85 Ft/s 10:38)
[F2] = CURS> Move the cursor one record to the right
and display the value and time of that
record in the status line:
(i.e.
5.31 Ft/s 10:38)
[F3] = <PAGE Display the previous page of records
[F4] = PAGE> Display the next page of records
[→] + [F1] = START Move the cursor to the first record on the
current page and post the date and time
of that record in the message line:
(i.e.
ST: 08 MAR 10:38)
[→] + [F2] = END Move the cursor to the last record on the
current page and post the date and time
of that record in the message line:
(i.e.
END 08 MAR 11:14)
[→] + [F3] = YMAX Display the programmed maximum Y
value in the message line:
(i.e.
YMAX 25.0 Ft/s)
[→] + [F4] = T INC Display the time increment value, as set
when the log file was created, in the
message line:
(i.e.
T INC 30 seconds)
[←] + [F1] = EXIT Leave the graphical LOG display and
return the display to the previous data
format. (The
[EXIT] key on the keypad will
also perform this function.)