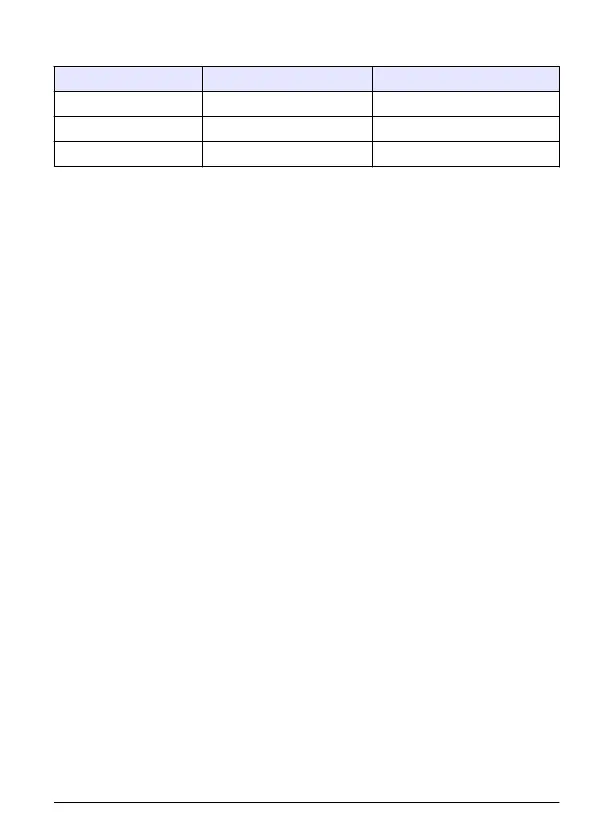
Table 1 Light wavelength and color (continued)
Sample color Light absorbed Wavelength (nm)
Blue Yellow 580
Green-blue Orange 600
Blue-green Red 655
Measurement range
The measurement range of the instrument is 0 to approximately
1.50 Abs, but can be used up to a measurement range of 2.5 Abs if the
chemistry method supports that range.
If sample absorbances are more than 1.50 Abs:
1. Dilute the sample or use smaller sample cells for the best linearity
and accuracy.
2. If a smaller sample cell such as the 1-cm (10-mL) cell is used,
complete the calibration with the smaller sample cells.
Note: Absorbance increases with the increase of the sample cell pathlength.
Use a sample cell with a shorter pathlength to measure solutions with a
darker colored.
3. Monitor the calibration curve to identify the measurement range for
a specific test.
The measurement range is the concentration range in which the
deviation from linearity is within acceptable limits.
Calibration curve
Calibration curves should ideally intersect the zero intercept for
absorbance. The zero intercept is the zero concentration point on the
calibration graph. When there is no analyte in the sample, the
absorbance will be zero.
A non-zero intercept (a positive or negative absorbance measurement
at zero concentration) can occur for many reasons. Factors that can
cause a non-zero intercept include the reagent blank, pH, temperature,
interfering species or turbidity differences between the zeroing solution
(blank) and the sample.
To adjust for a non-zero intercept caused by the reagent blank,
measure the absorbance of the prepared reagent blank and then
subtract it from the measured absorbance of the prepared sample. In
English 15
 Loading...