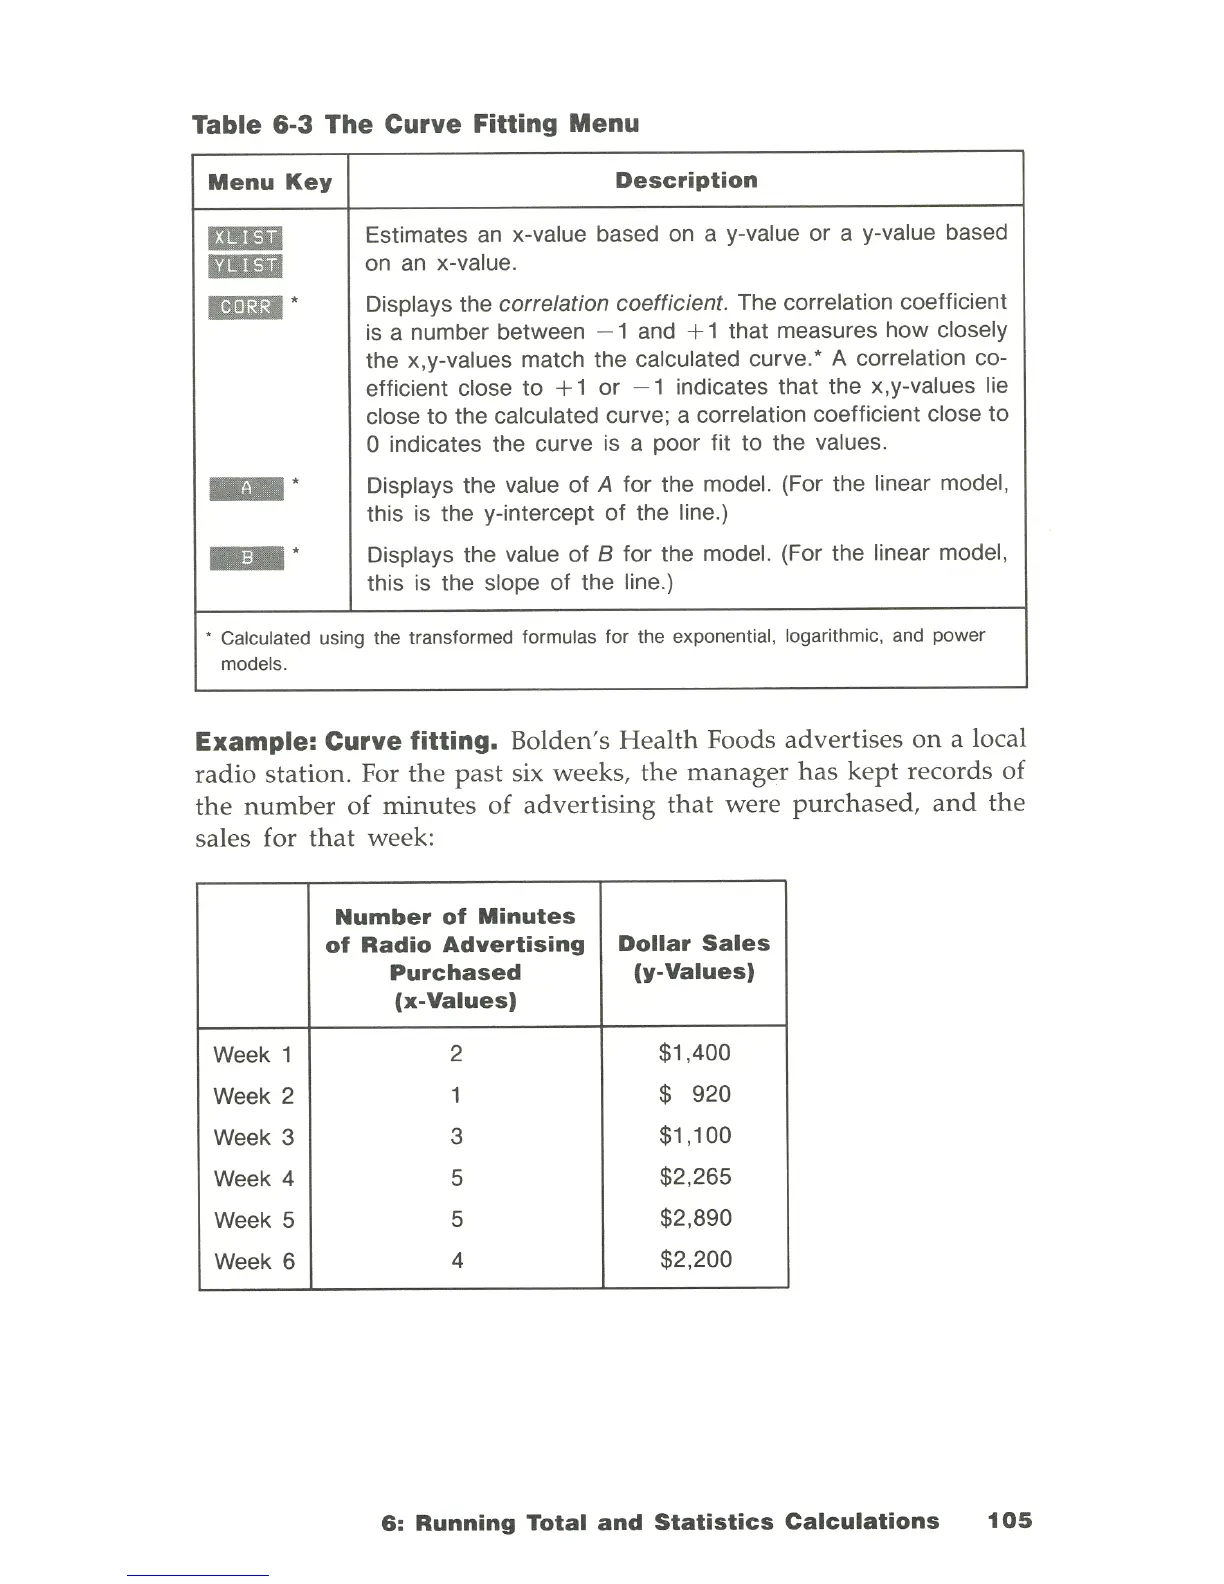
Table 6-3
The
Curve Fitting Menu
Menu
Key
Description
EtIIII
Estimates
an
x-value based on a y-value
or
a y-value based
I11III
on an x-value.
111mB
-
Displays the correlation coefficient. The correlation coefficient
is a number between
-1
and + 1 that measures
how
closely
the x,y-values match the calculated curve. - A correlation co-
efficient close
to
+ 1
or
- 1 indicates that the x,y-values lie
close
to
the calculated curve; a correlation coefficient close
to
o indicates the curve is a poor fit
to
the values.
--
Displays the value
of
A
for
the model. (For the linear model,
this is the y-intercept
of
the line.)
- -
Displays the value
of
B
for
the model. (For the linear model,
this is the slope
of
the line.)
• Calculated using the transformed formulas for the exponential, logarithmic, and power
models.
Example: Curve fitting. Bolden's
Health
Foods advertises
on
a local
radio
station. For
the
past
six weeks,
the
manager
has
kept
records
of
the
number
of
minutes
of
advertising
that
were
purchased,
and
the
sales for
that
week:
Number
of
Minutes
of
Radio
Advertising
Dollar
Sales
Purchased
(y-Values)
(x-Values)
Week 1 2 $1,400
Week 2 1 $
920
Week 3
3
$1,100
Week 4
5
$2,265
Week 5 5
$2,
890
Week 6 4 $2,200
6:
Running
Total
and
Statistics
Calculations
105
 Loading...