Model 4342A
Section III
Paragraphs 3-49 to 3-44
3-39.
Inductance Measurement (at a desired
frequency).
3-40.
Occasionally it
may
be necessary to
measure inductance at frequencies other than
the specific "L" frequencies. The frequency
characteristic measurements of an inductor
or of an inductor core are representative
examples.
In such instances, the inductance
may
be measured as follows:
a.
Connect unknown inductor and resonate
it using the procedure
same as
des-
cribed in Q Measurement (para. 3-34)
steps a through e.
b. Note FREQUENCY dial, L/C dial C scale
and AC dial readings. Substitute these
values in the following equation:
L = l/w2C "N0.0253/f2C . . . . . (eq. 3-5)
Where, L:
inductance value (indicated
L)
of
sample in henries.
f: measurement frequency in
hertz.
W:
2~r times the measurement
frequency.
c:
sum of C and AC dial
readings in farads.
Cd
,4,,A;,i~,
I
r
Cd
3-41. MEASUREMENTS REQUIRING CORRECTIONS.
3-42. Effects of Distributed Capacitance.
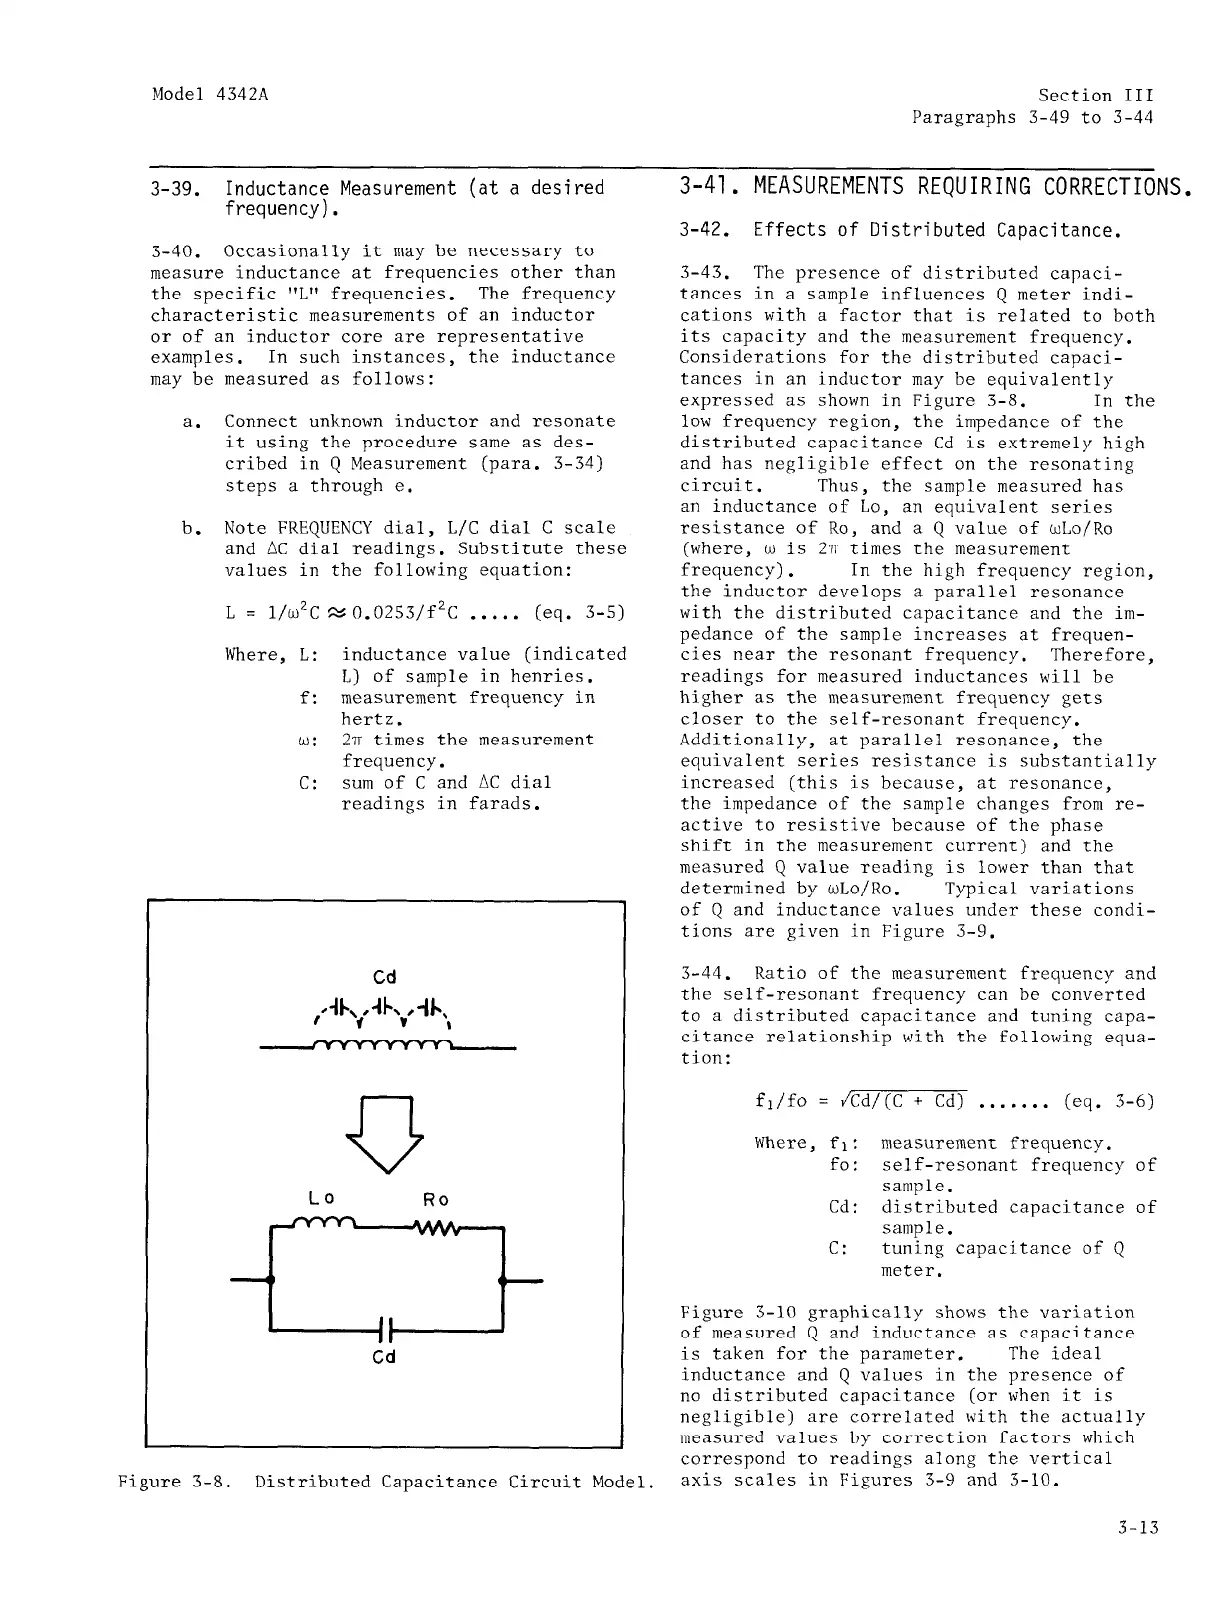
3-43. The presence of distributed capaci-
tances in a sample influences Q meter indi-
cations with a factor that is related to both
its capacity and the measurement frequency.
Considerations for the distributed capaci-
tances in an inductor may be equivalently
expressed as shown in Figure 3-8. In the
low frequency region, the impedance of the
distributed capacitance Cd is extremely high
and has negligible effect on the resonating
circuit. Thus, the sample measured has
an inductance of Lo, an equivalent series
resistance of Ro, and a Q value of wLo/Ro
(where, w is 2~ times the measurement
frequency). In the high frequency region,
the inductor develops a parallel resonance
with the distributed capacitance and the im-
pedance of the sample increases at frequen-
cies near the resonant frequency.
Therefore,
readings for measured inductances will be
higher as the measurement frequency gets
closer to the self-resonant frequency.
Additionally, at parallel resonance, the
equivalent series resistance is substantially
increased (this is because, at resonance,
the impedance of the sample changes from re-
active to resistive because of the phase
shift in the measurement current) and the
measured Q value reading is lower than that
determined by wLo/Ro. Typical variations
of Q and inductance values under these condi-
tions are given in Figure 3-9.
3-44.
Ratio of the measurement frequency and
the self-resonant frequency can be converted
to a distributed capacitance and tuning capa-
citance relationship with the following equa-
tion:
fl/fo = kd/(C + Cd) . . . . . . . (eq. 3-6)
Where, fi: measurement frequency.
fo: self-resonant frequency of
sample.
Cd:
distributed capacitance of
sample.
c: tuning capacitance of Q
meter.
Figure 3-10 graphically shows the variation
of measured Q and inductance as capacitance
is taken for the parameter.
The ideal
inductance and Q values in the presence of
no distributed capacitance (or when it is
negligible) are correlated with the actually
measured values by correction factors which
correspond to readings along the vertical
Figure 3-8. Distributed Capacitance Circuit Model.
axis scales in Figures 3-9 and 3-10.
3-13
 Loading...