ColorFlex EZ User’s Manual Version 2.2
23
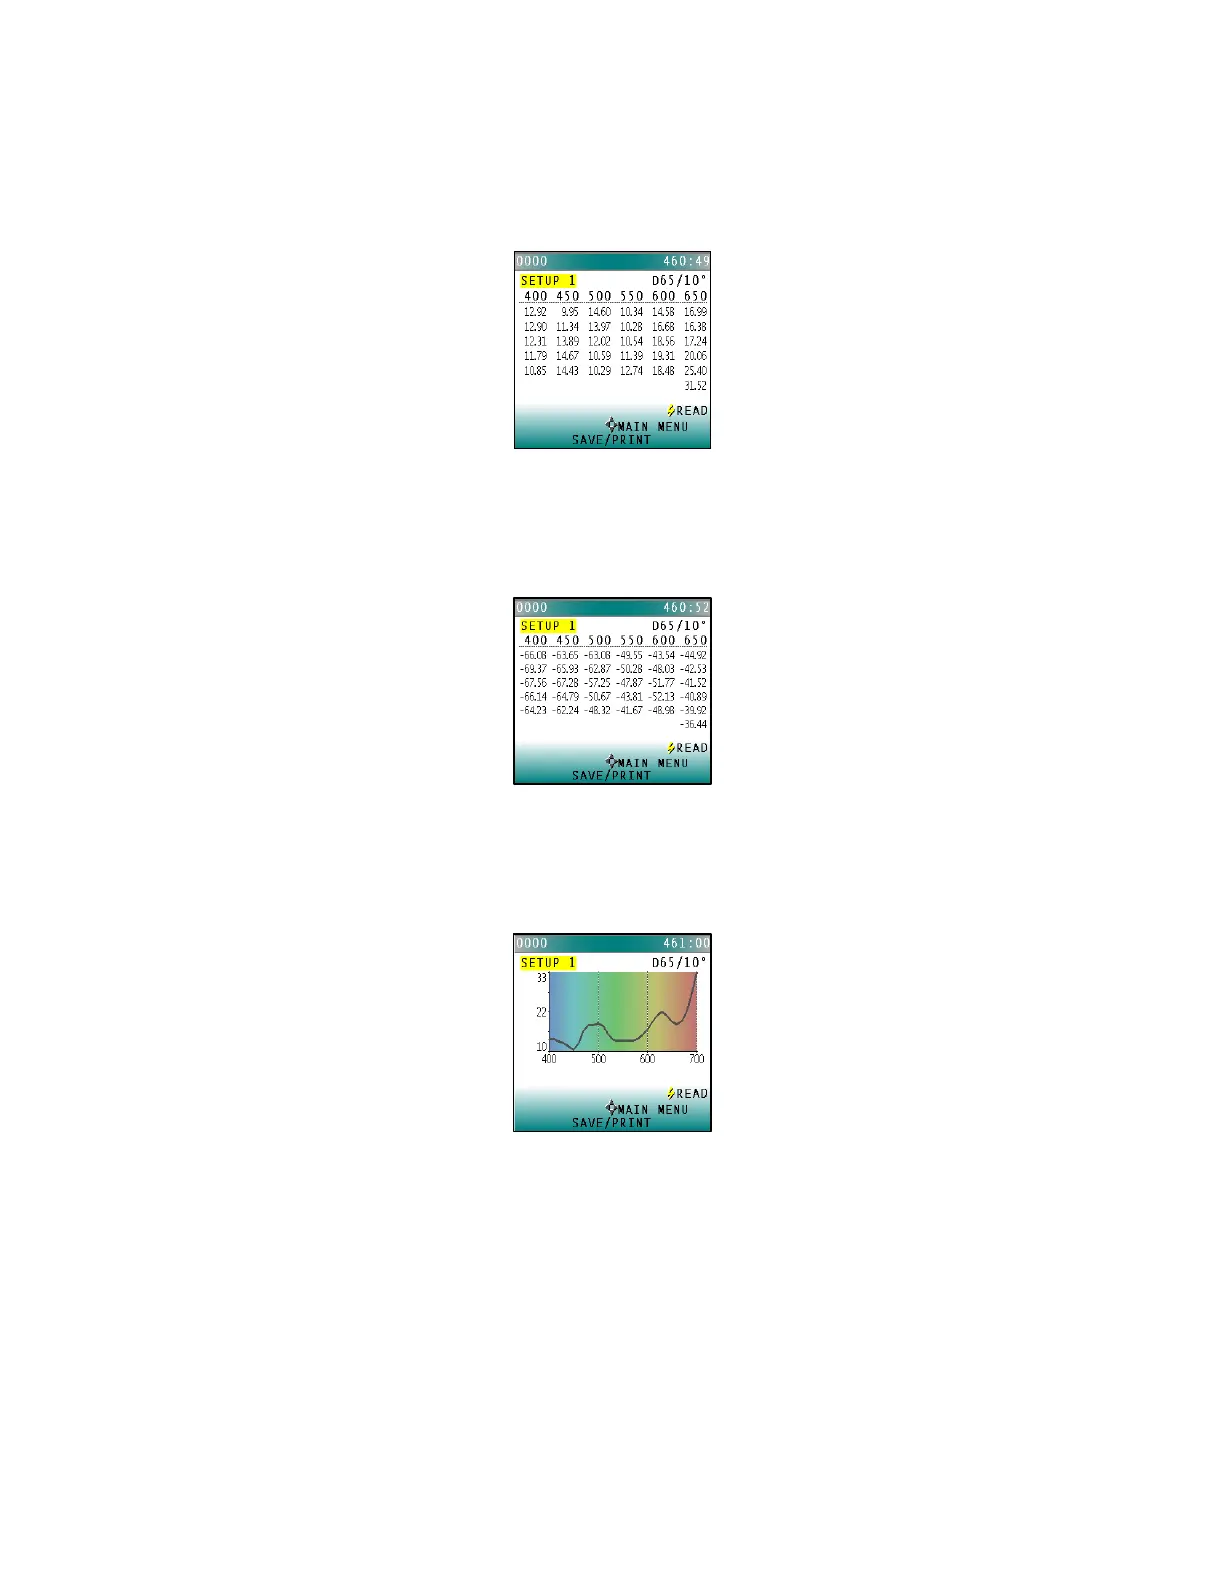
▪ Spectral Data
Spectral Data displays the raw reflectance values for each wavelength read
by the instrument for the most recent standard or sample.
Figure 29. Spectral Data
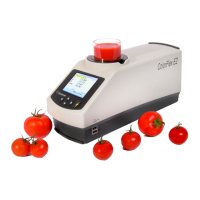
▪ Spectral Difference
Spectral Difference displays the raw reflectance difference between the
standard and the most recent sample for each wavelength.
Figure 30. Spectral Difference
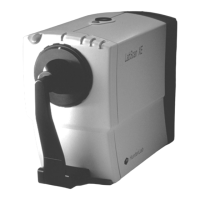
▪ Spectral Plot
Spectral Plot graphs the raw reflectance values for each wavelength for the
most recent standard or sample.
Figure 31. Spectral Plot
▪ Diff Plot
Spectral Difference plots the raw reflectance difference between the
standard and the most recent sample at each wavelength.