Micro-JLT GNSS™ User Manual
70 © 2019 Jackson Labs Technologies, Inc.
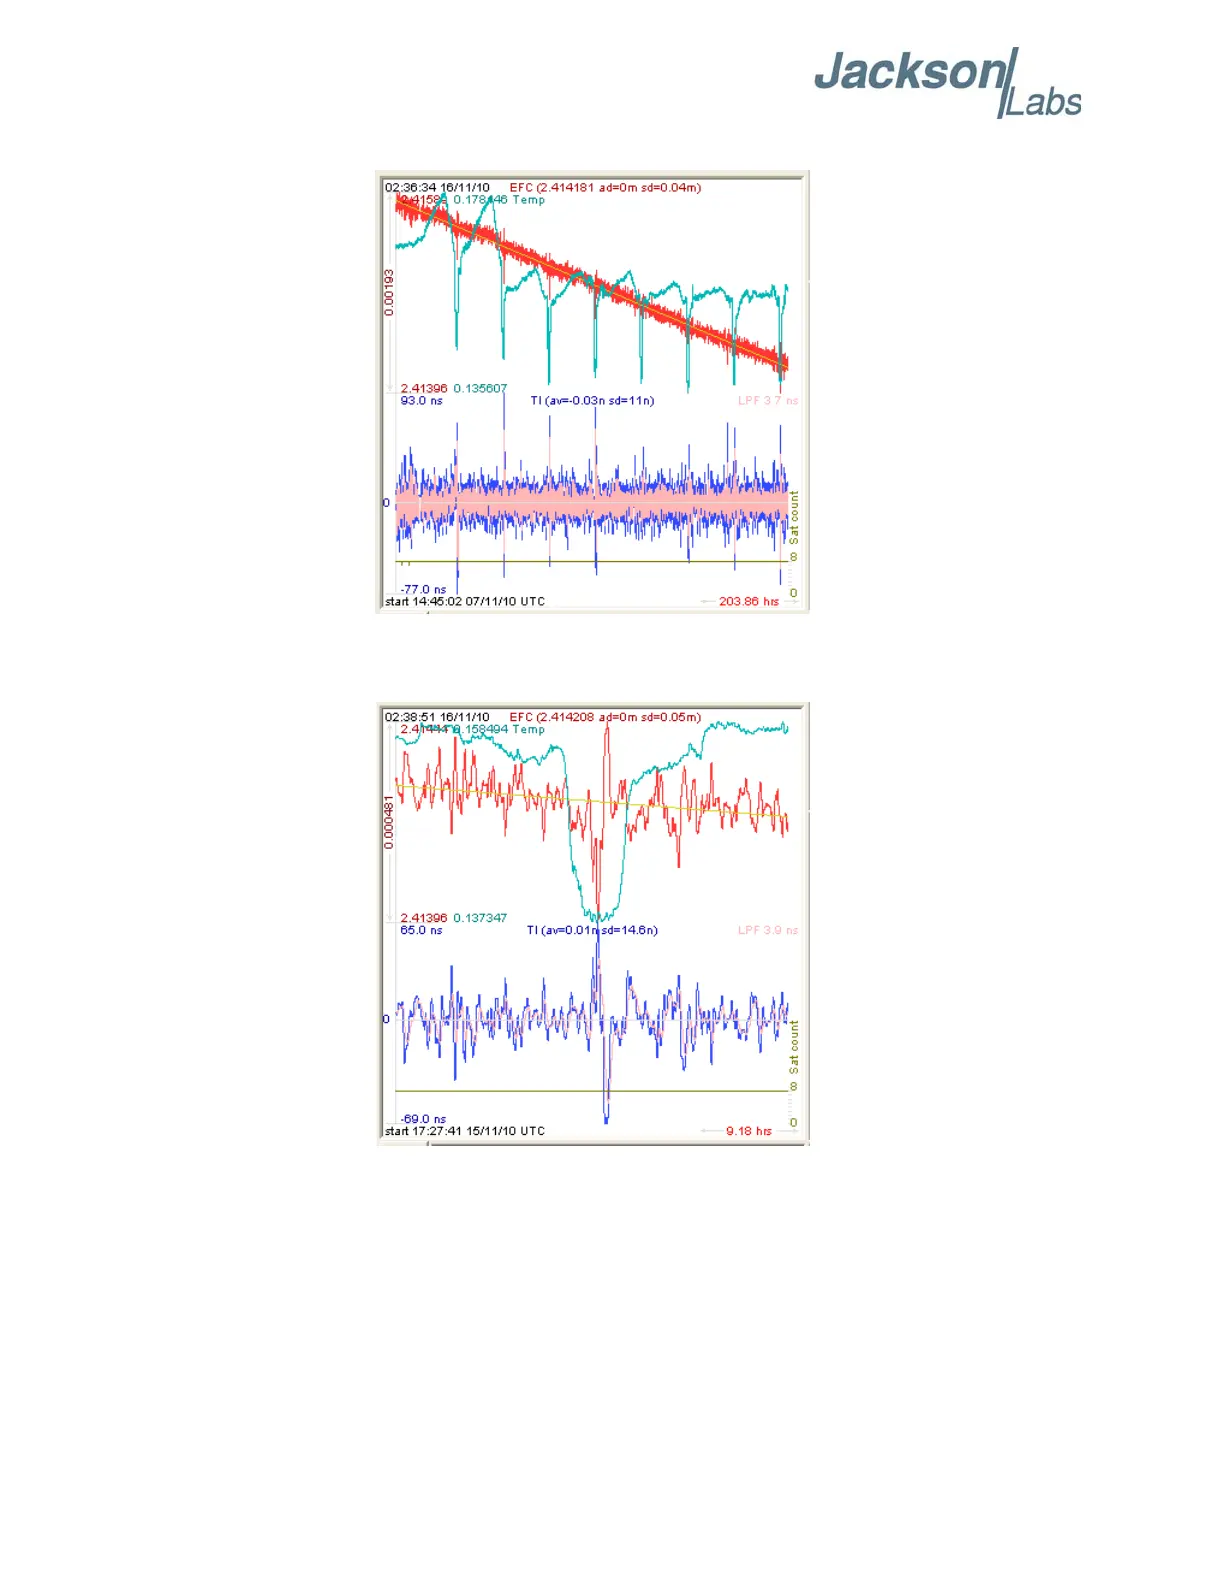
Figure 5.8 Captured Data Example
Figure 5.9 Zoomed Captured Data Example
5.4 Interpreting the Data
Figure 5.8 shows the data acquired by the Micro-JLT GNSS™ unit over a period of more than 200
hours The red trace is EFC (crystal frequency control voltage). The crystal is aging (becoming faster
in frequency over time). This requires the control voltage to be lowered to maintain precisely
10.0MHz. A drift of ~2mV is visible over 200 hours. On the left side of the screen the EFC range
over this 200 hour plot is displayed vertically as 0.00193V. This means the drift of the EFC voltage