17
2 Device description
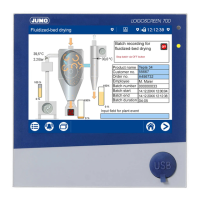
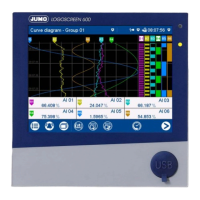
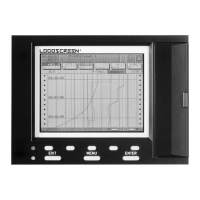
Visualization
window
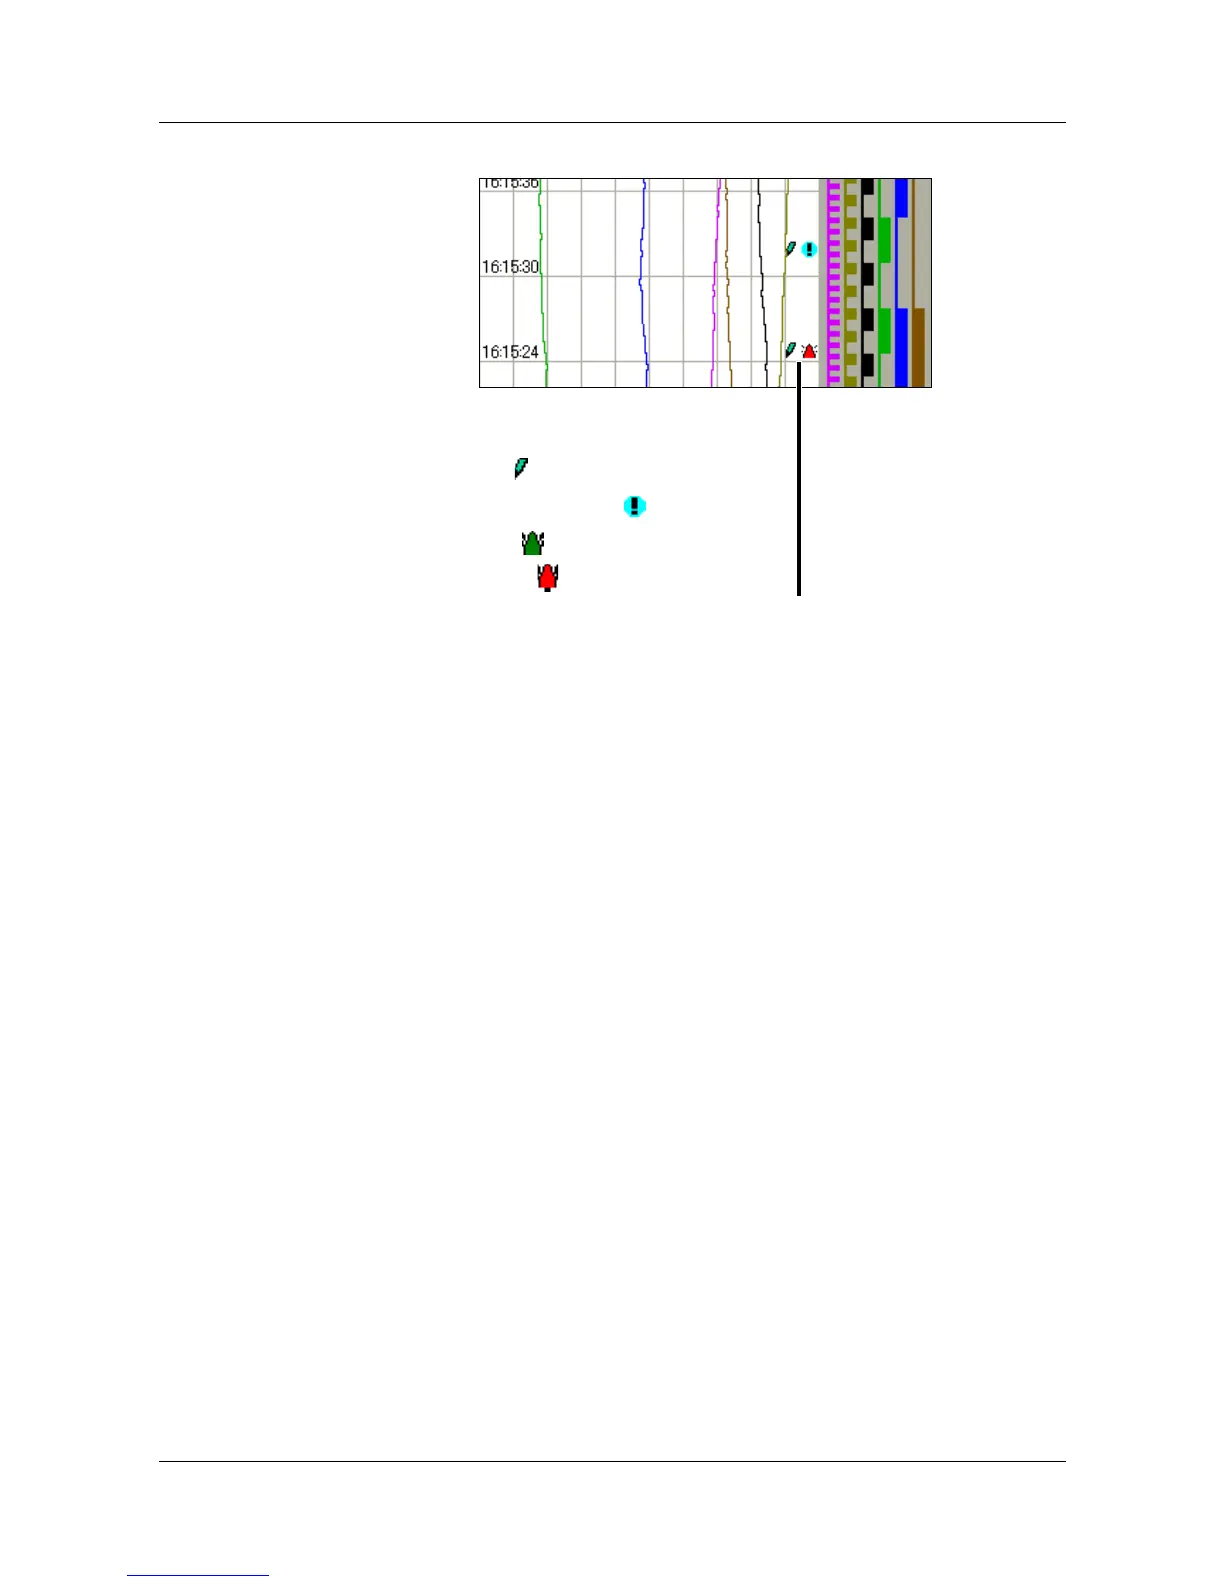
(diagram)
In the visualization window, the measurements are shown in graphical form.
Alarms are indicated by a red or orange color for the curve (can be configured
in the setup program).
Communication with the operator (device configuration, checking alarm and
event lists etc.) also takes place through the visualization window.
Symbols for data acquisition:
Comment has been entered
Event occurred
Alarm is no longer present
Alarm has been signaled