62
Note: For measuring breakdown voltage Vce(sus) or BVceo, short integra-
tion would be better for finishing measurement faster on breakdown
condition, but longer integration time would be better for measuring
the leakage current Iceo in precise. The example uses MEDEUM Inte-
gration time.
Step 6. Set Extended parameters:
f. Set "XVceMax_R100k" parameter: This parameter set X-axis maximum
scale of the output graph that is used only when the 100 kΩ series resis-
tor is selected. This is because the VcStop parameter cannot be used for
X-axis max. scale.
g. Set " R100k_Cal" parameter:
This is a field to set the real calibrated 100 kΩ value for compensating
the voltage drop by the series resistor.
You can expect a voltage compensation error of less than 0.1% if you
calibrate the 100 kΩ resistor by using the example Classic Test definition
introduced in the later section.
Step 7. Make sure the device is properly selected as shown in the "Device used in
the example" part or your selection.
Close the lid of N1259A test fixture.
Start the measurement. (Click the Single button )
Note:
"Insert 100 kohm between the collector SMU and the collector!" mes-
sage window pops up. Make sure a 100 k
Ω
resistor is connected be-
tween the HVSMU output and the collector terminal, and press the OK
button to continue the test.
Note: In case no 100 k
Ω
resistor is inserted between the HVSMU and the
collector terminal:
There is no hazard at this moment because the measurement is not yet
started, but make sure the red High Voltage light on the B1505A front
panel and the Shock Hazard warning light of the N1259A Test Fixture is
not lit.
After assuring no high voltage is output from the B1505A, then recon-
nect the cable as shown in figure 3-12 and close the N1259A fixture
cover. Press the OK button to continue the test.
Step 8. The graph window pops up, and the measurement starts.
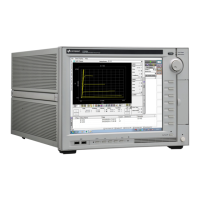
Step 9. You can see the Ic-Vceo_R graph in figure 3-16.
Figure 3-16 plots Icollector versus Vce. The VBceo and Iceo are automatically ex-
tracted at the specified condition, and the parameters are shown in the Parameters
display field.
 Loading...

