Standard View
Symbol/Field Description
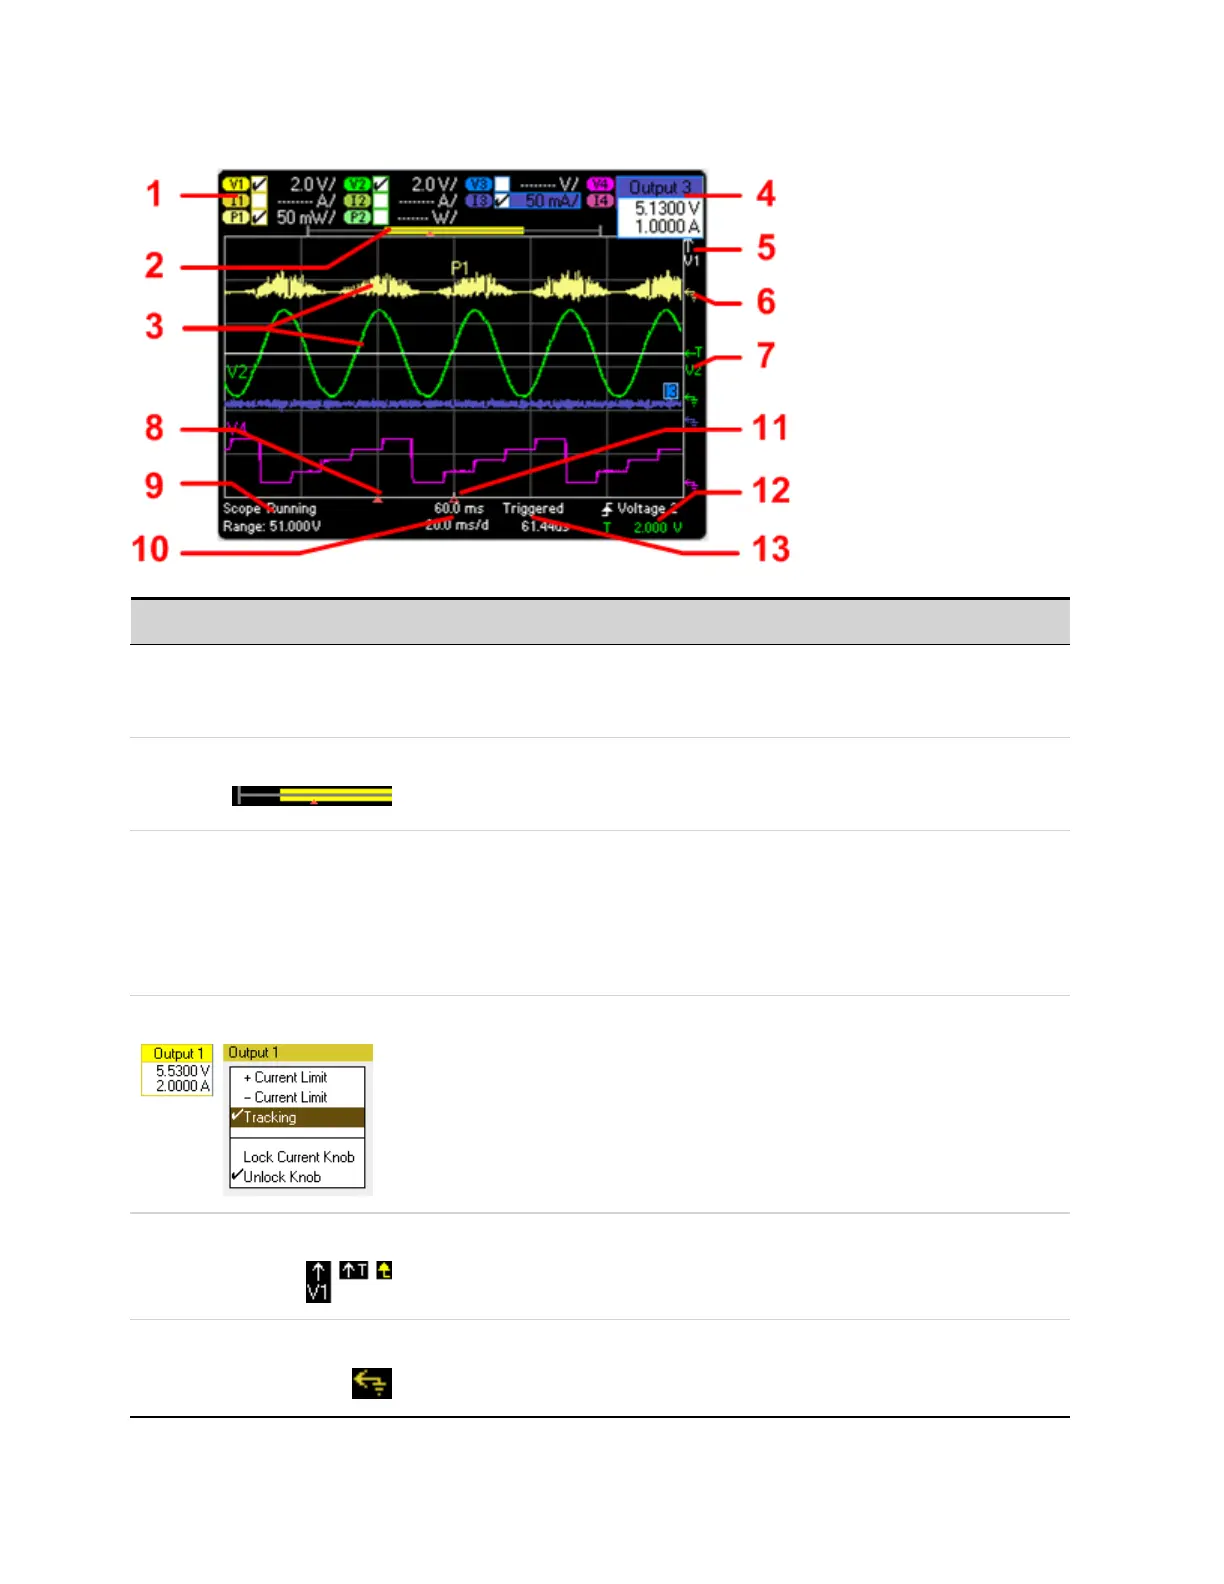
1 Trace Controls Identifies the volt/div. or curr/div. setting. √ indicates the traceis on.
Dashes (----) indicatethe traceis off.
Selectthe traceand press Enter to turn iton or off.
2 Data Bar The data bar represents all of the waveform data thathas been collected.
The yellow part indicates the portion of the data that is visible on the display.
The black part represents the data that is not visible.
3 Scope Traces Voltage trace labels appear on the leftside of the grid (V1 V2, V3, V4).
Current tracelabels appear on the right side of the grid (I1, I2, I3, I4).
Power trace labels appear on the center of the grid (P1, P2, P3, P4).
If a portion of a traceis red, itmeans that portion of the trace is out of range. Push the Trigger Level
knob to autoscale the traces. This will trigger a newmeasurement.
Only Models N676xA and N678xA SMU can display power traces.
4 Output Pop-ups Turning the voltage and current knobs displays a pop-up dialog showing the present output
settings.
Pushing the voltage and current knobs displays a pop-up dialog allowing the following actions:
• Lock/Unlock the voltage or current knobs.
• On Models N678xA, select a limit parameter to control or select limittracking.
5 Out of ViewArrows Indicate that the trace, V1 in the figure, is out of view.
Use the Vertical Volt/Div knob or the Vertical Offsetknob to bring the trace into view.
Push the Trigger Level knob to autoscale the traces. This will trigger a new measurement.
6 Ground Reference The ground reference of the trace. Ground references are offsetso that they do not overlap. The
ground reference offset value is referenced to the horizontal center line of the grid.
4 Using the Measurement Functions
136 Keysight N6705C Operating and Service Guide