96 Keysight InfiniiVision 3000T X-Series Oscilloscopes User's Guide
4 FFT Spectral Analysis
Aliasing happens when there are frequency components in the signal higher than
half the sample rate. Because the FFT spectrum is limited by this frequency, any
higher components are displayed at a lower (aliased) frequency.
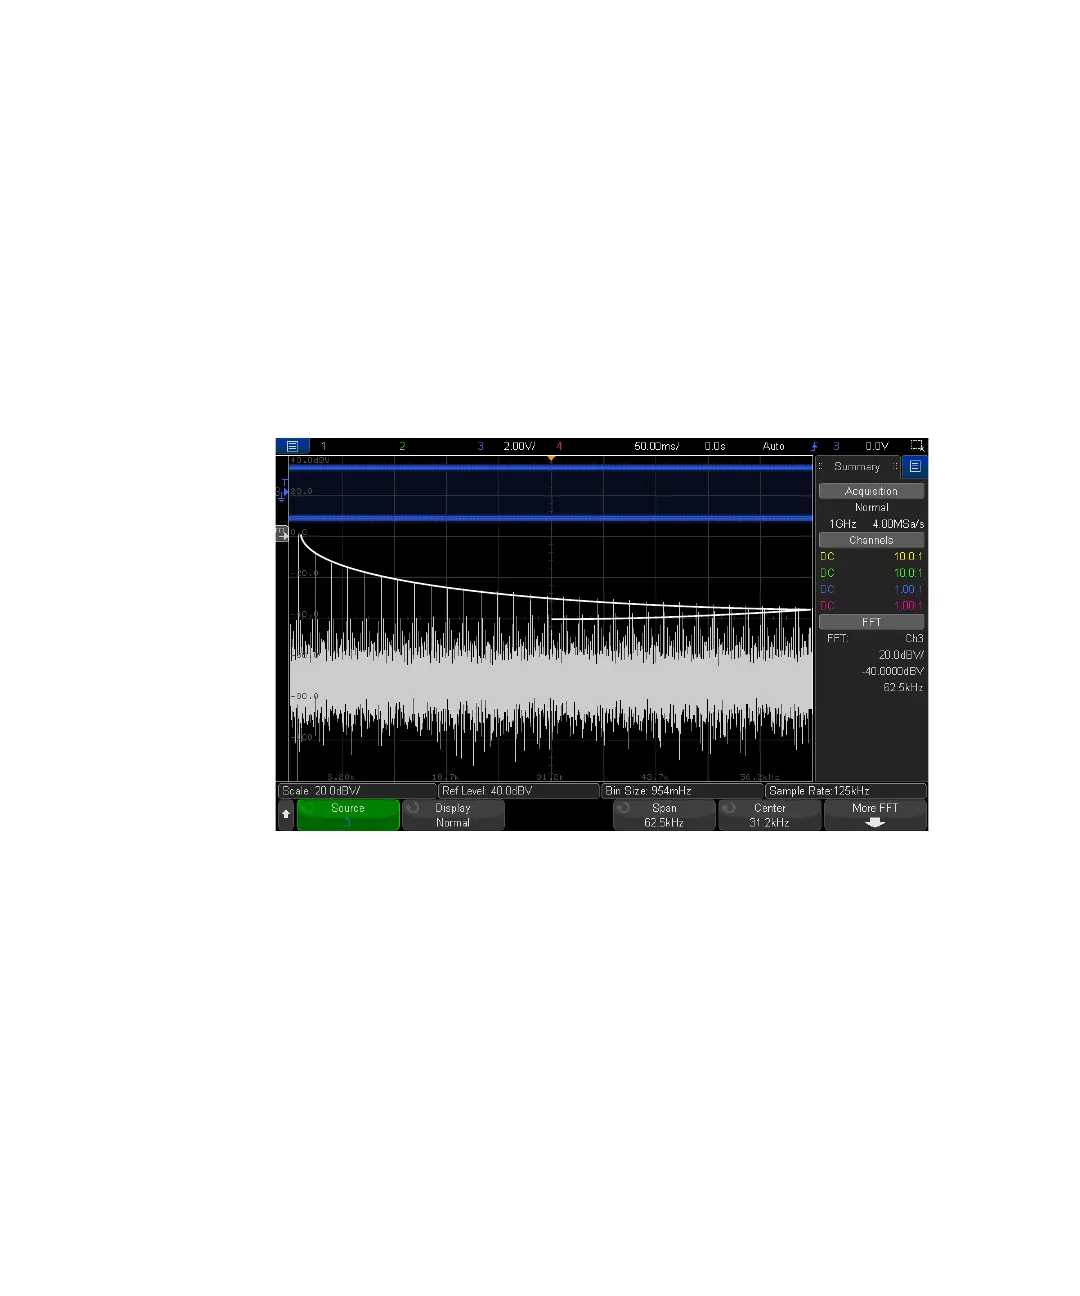
The following figure illustrates aliasing. This is the spectrum of a 990 Hz square
wave, which has many harmonics. The horizontal time/div setting for the square
wave sets the sample rate and results in a FFT resolution of 1.91 Hz. The displayed
FFT spectrum waveform shows the components of the input signal above the
Nyquist frequency to be mirrored (aliased) on the display and reflected off the right
edge.
Because the frequency span goes from ≈ 0 to the Nyquist frequency, the best way
to prevent aliasing is to make sure that the frequency span is greater than the
frequencies of significant energy present in the input signal.
Figure 5 Aliasing