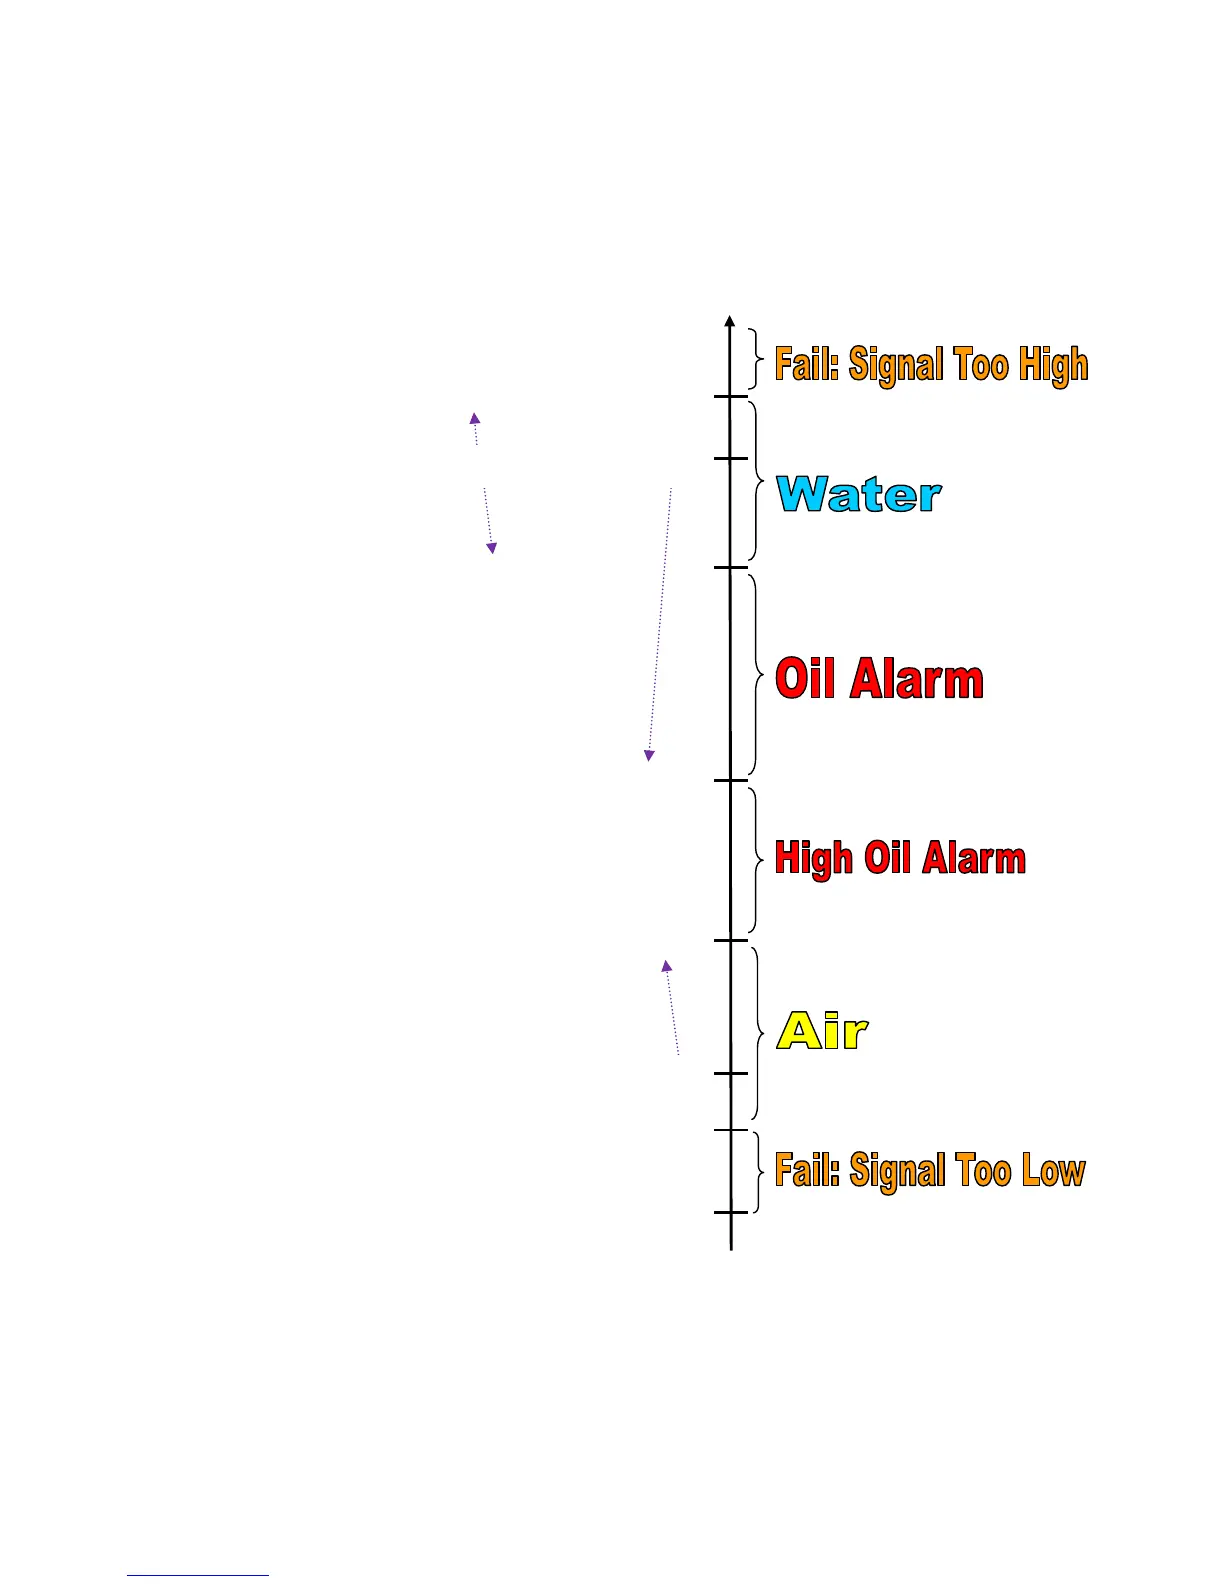
The following diagram reflects the relation between sensor output signal, set-points, calibration
points and possible status messages that are shown on the front panel Lights, on optional LCD
display, on the PC screen, and the information sent to the SCADA.
The shown µA signal values are typical to ID-223 sensors. Signal decrease means a thicker oil
layer.
Set Points & Calibration Points (µA) Sensor Status
1700µA
1600µA
1570µA
1480µA
900µA
800µA
600µA
0µA