D–11
Parameter Measurement
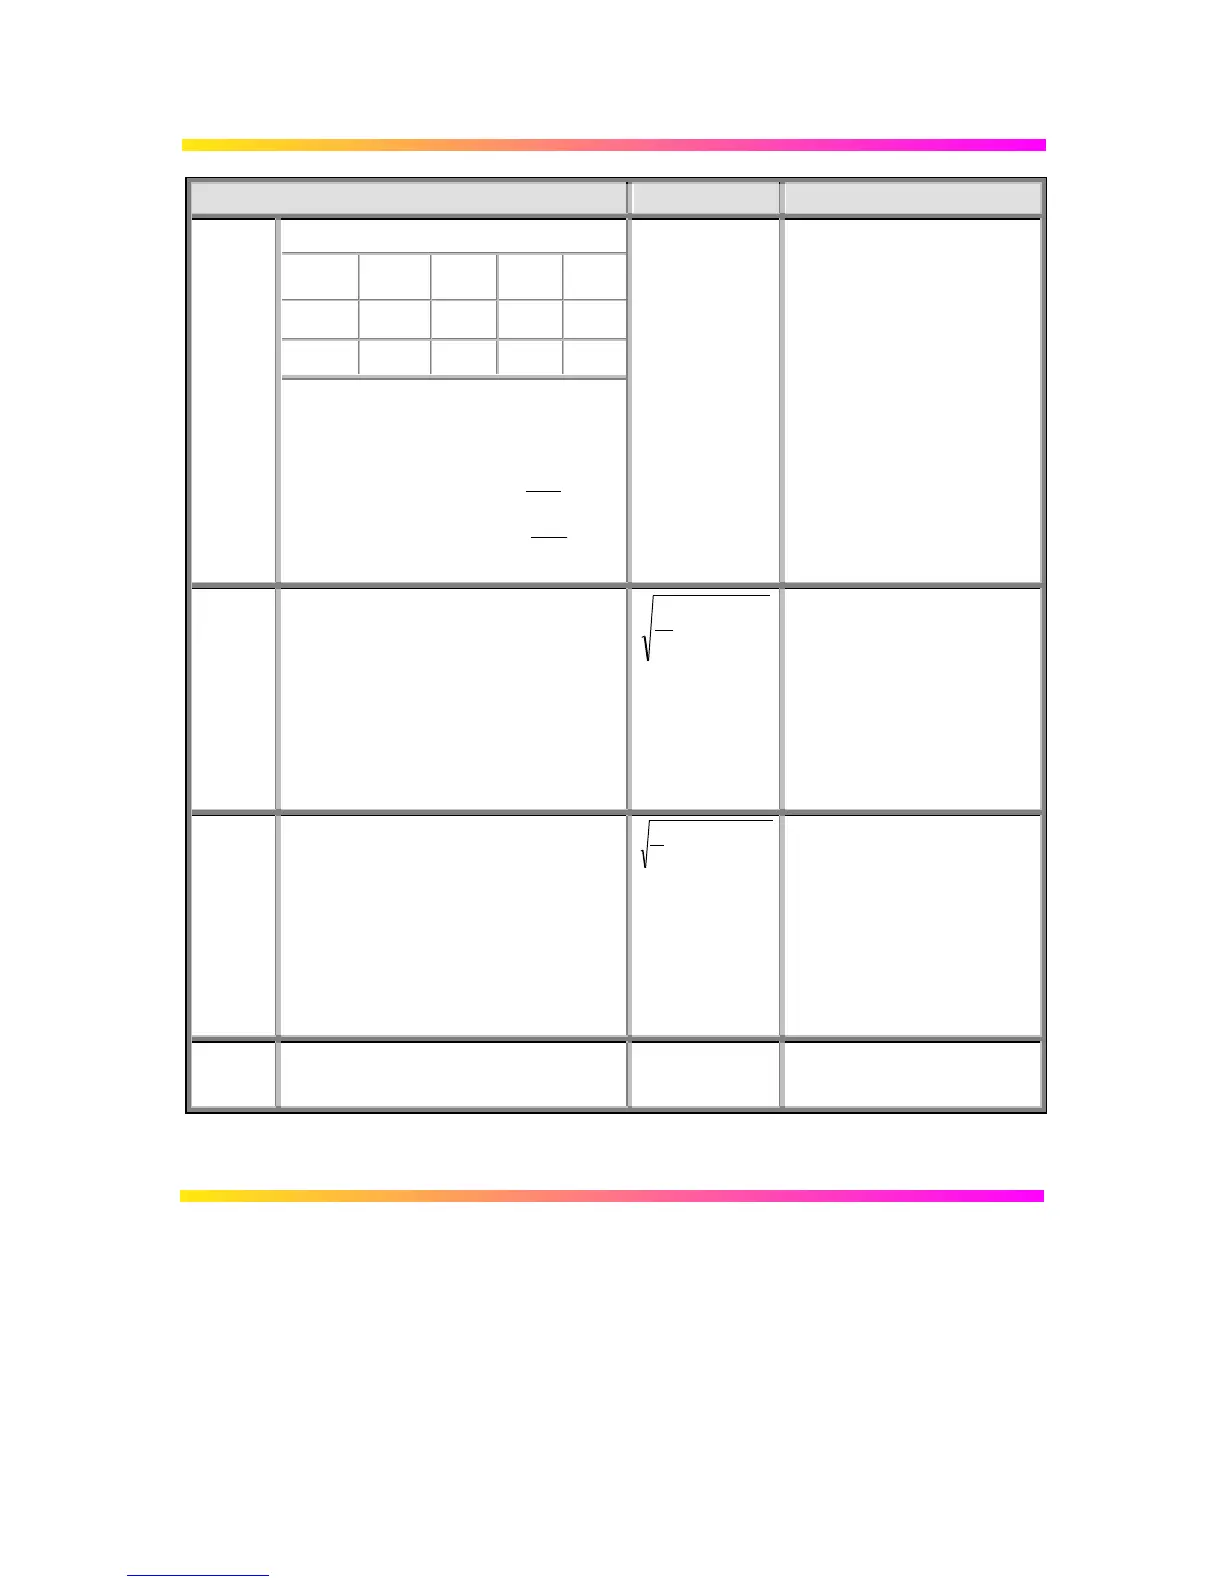
Parameter and what it does Definition Notes
Arguments
Threshold Remote
Lower
Limit
Upper
Limit
Default
Lower low 1 % 45 % 10 %
Upper high 55 % 99 % 90 %
Threshold arguments specify two vertical values
on each edge used to compute rise time.
Formulas for upper and lower values:
lower value lower threshold= × +
amp
base
100
upper value upper threshold= × +
amp
base
100
rms
Root Mean Square of data between the
cursors — about same as sdev for a
zero-mean waveform.
1
2
1
N
v
i
i
N
( )
=
∑
(See Fig. D–2)
Gives similar result when applied to
time domain waveform or histogram
of data of same waveform. But with
histograms, result may include
contributions from more than one
acquisition.
Where:
v
i
denotes measured sample
values, and N = number of data
points within the periods found up to
maximum of 100 periods.
sdev
Standard deviation of the data between
the cursors — about the same as rms
for a zero-mean waveform.
∑
=
−
N
i
i
)meanv(
N
1
2
1
(See Fig. D–2)
Gives similar result when applied to
time domain waveform or histogram
of data of same waveform. But with
histograms, result may include
contributions from more than one
acquisition.
Where:
v
i
denotes measured
sample values, and N = number of
data points within the periods found
up to maximum of 100 periods.
t@level
Time at level: Time from trigger (t=0) to
crossing at a specified level.
Time from
trigger to
crossing level
 Loading...