WAVERUNNER XI SERIES
LogSamples = Log(Samples)
XScale = Samples / LogSamples
' Set the scale using DSO variables
Dim Top, Bot As Single
Top = WM.Math.F1.Out.Result.VerticalFrameStop
Bot = WM.Math.F1.Out.Result.VerticalFrameStart
Picture1.Scale (0, Top)-(Samples, Bot)
226 WRXi-OM-E Rev C
End If
OldLogX = LogX: OldWave = Y
Next X
End Sub
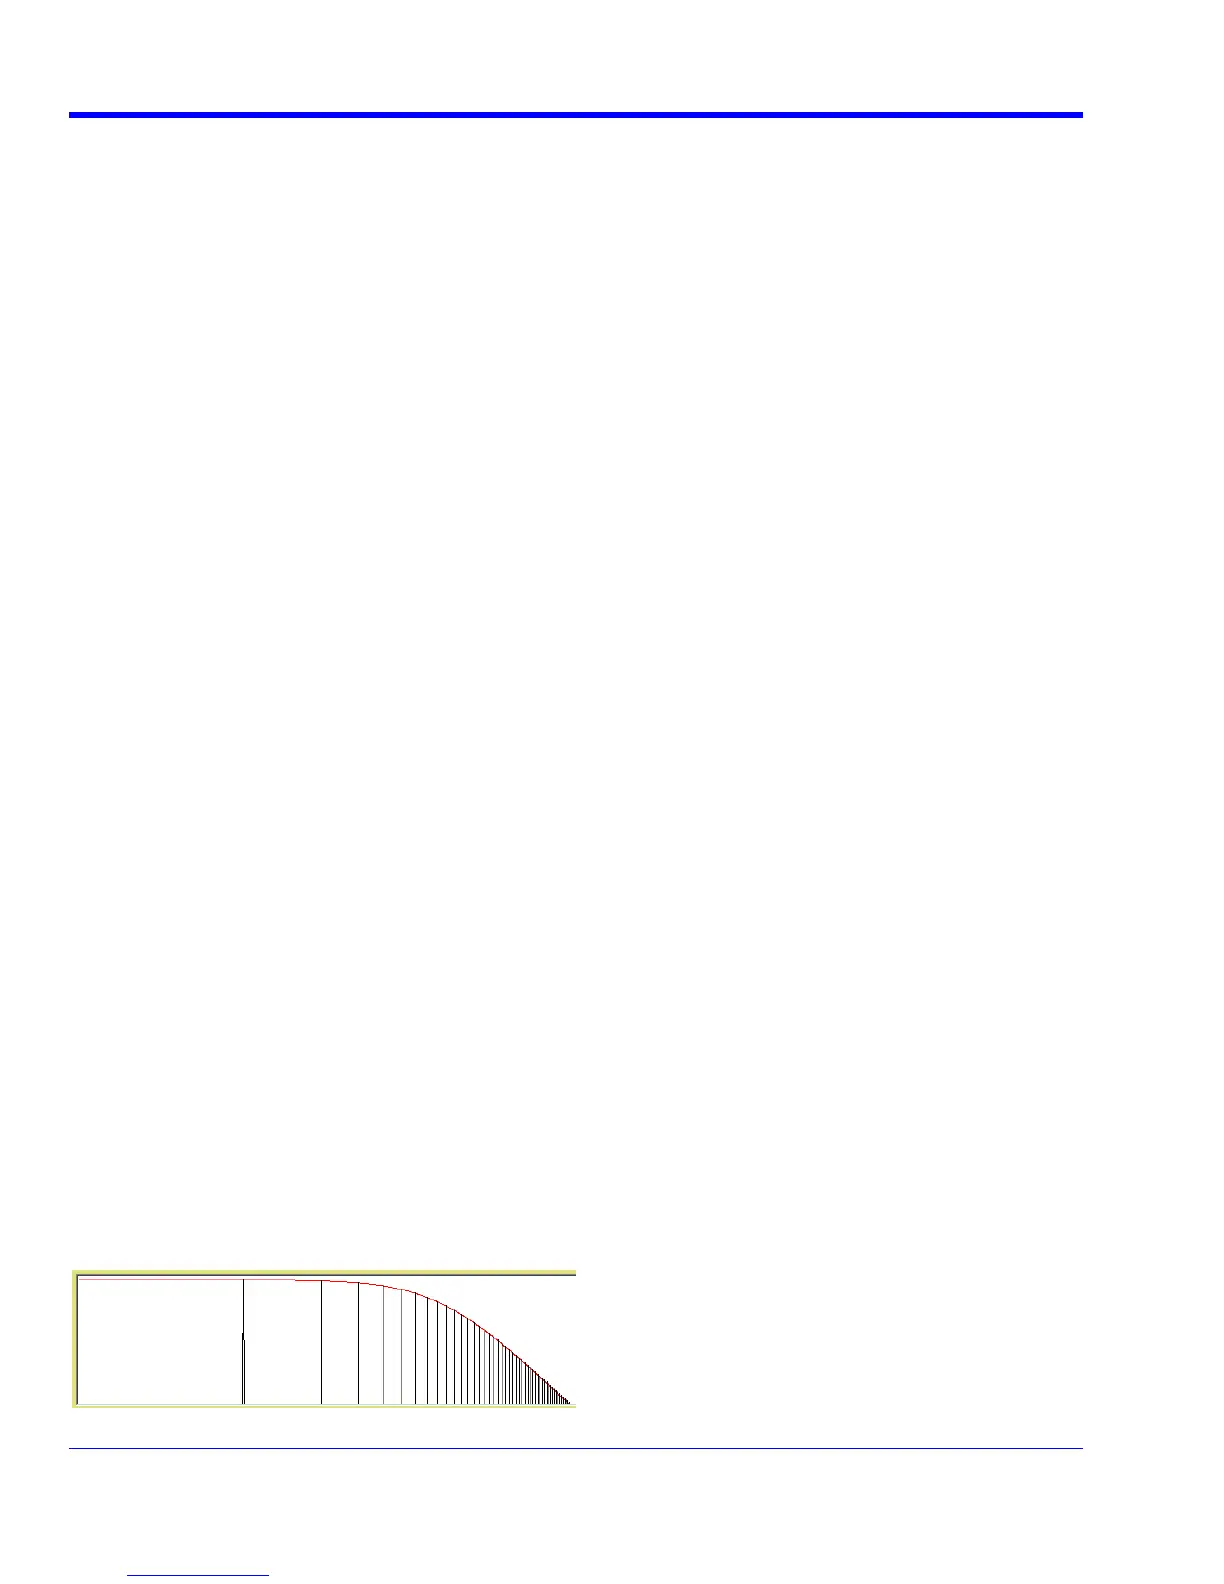
Here is an example showing a simple one-pole roll-off compared to a curve.
Dim Wave
Wave = WM.Math.F1.Out.Result.DataArray
Dim Black, White, Blue, Red As Long
Black = 0: White = &HFFFFFF
Blue = &HFF4444: Red = &HFF
' Draw a theoretical curve for the peaks.
StartPoint = Top + 20#: EndPoint = -54.5
Picture1.Line (0, StartPoint)-(Samples, EndPoint), Red
' Draw the plot with linear interpolation between points.
For X = 1 To Samples
LogX = XScale * Log(X): Y = Wave(X)
If X > 1 Then
Picture1.Line (LogX, Y)-(OldLogX, OldWave), Black

 Loading...
