OPERATOR’S MANUAL
WRXi-OM-E Rev C 225
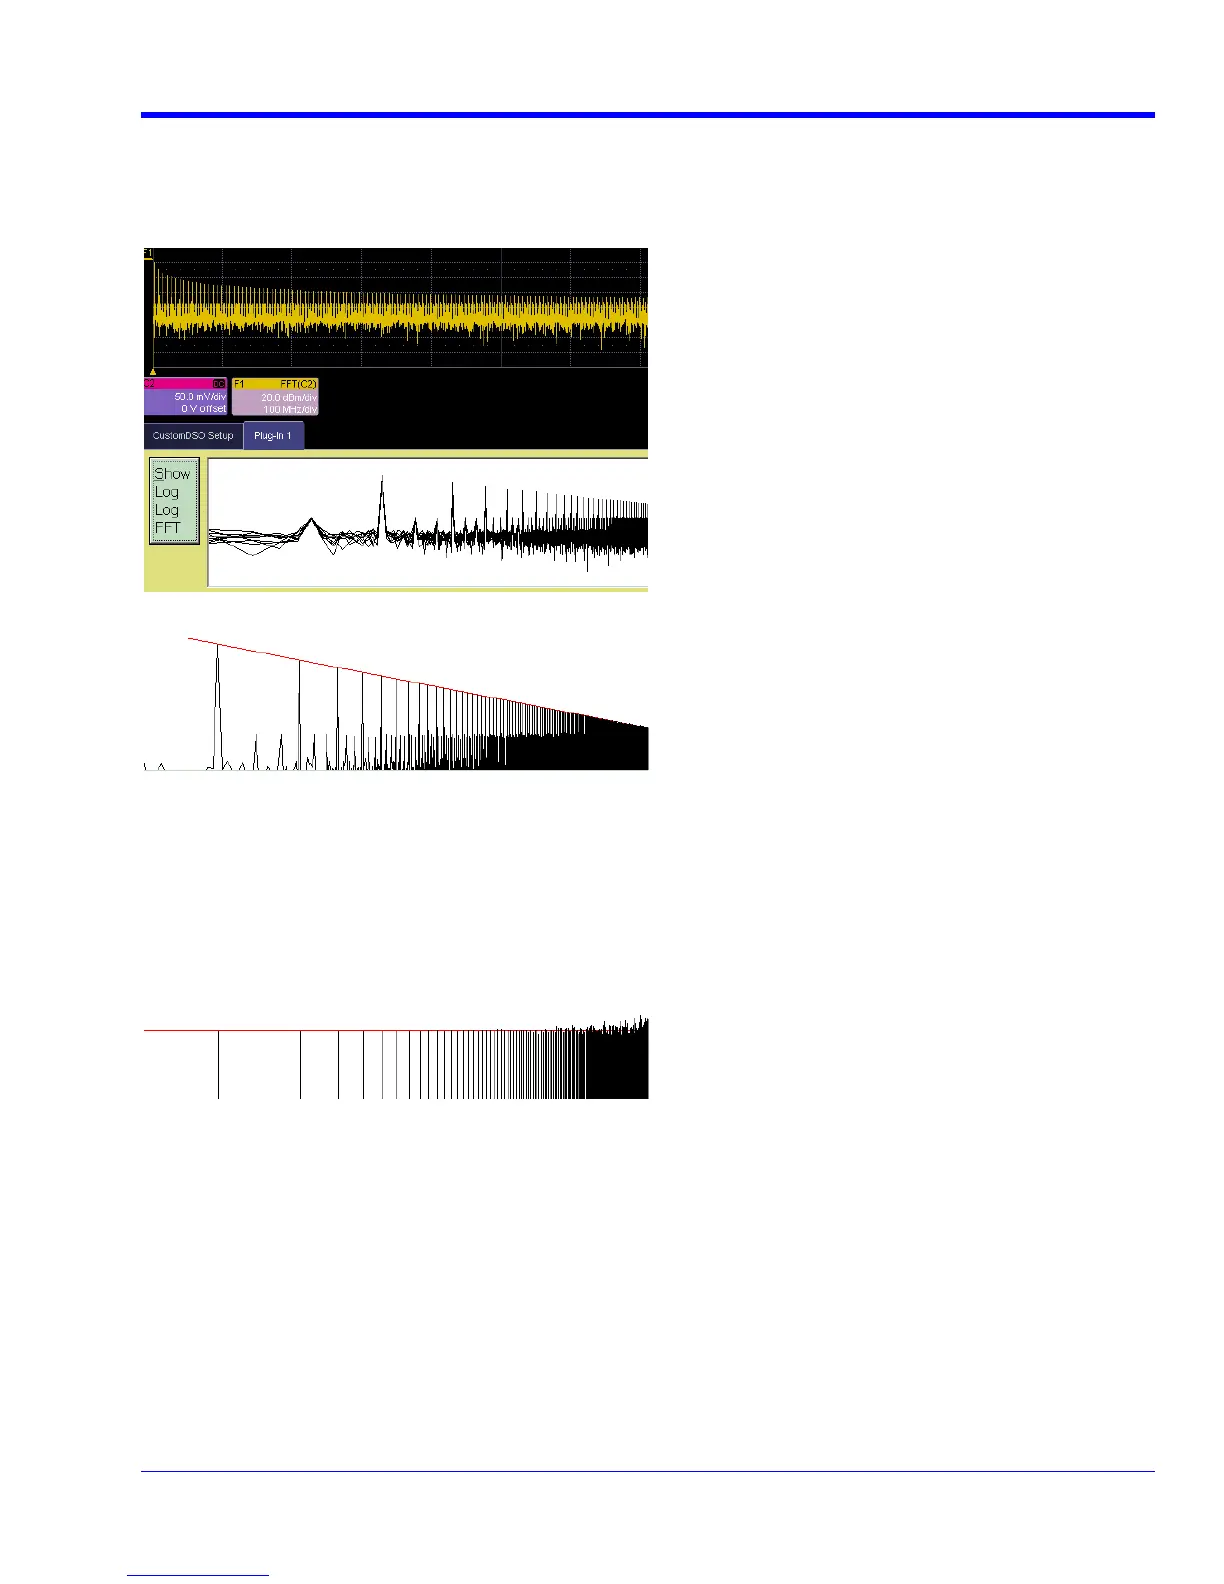
Second Example PlugIn – Log-Log FFT Plot
ctrum on two logarithmic scales. The instrument provides a
tical scale, so CustomDSO has only to change the horizontal one. Here is an example. The first figure has
en truncated on the right side.
A frequent requirement is to plot a frequency spe
ver
be
ples were made with two different instrument setups: in the second, the FFT was zoomed vertically.
The graph has a red line to represent the theoretical envelope for the peaks. This has great potential for testing
mplifiers and filters, since the output can be compared with a theoretical
rmore, if the output is divided by the curve, the result for a perfect DUT would be a horizontal line,
which is ea to inspect. The example below has been magnified vertically by a factor of ten. The rise at the right
e occurs because the signal is descending into the noise.
These exam
the transmission characteristics of a
curve. Furthe
sy
sid
logarithmic horizontal scale.
WM As Object
Set WM = CreateObject("LeCroy.XStreamApplication")
Samples = Samples - 1 ' Make it a round number.
' Calculate the horizontal scale.
Private Sub Command1_Click()
' Draw a DSO trace on a
Dim
Dim Samples As Long
Samples = WM.Math.F1.Out.Result.Samples

 Loading...
