WAVE RUNNER XI SERIES
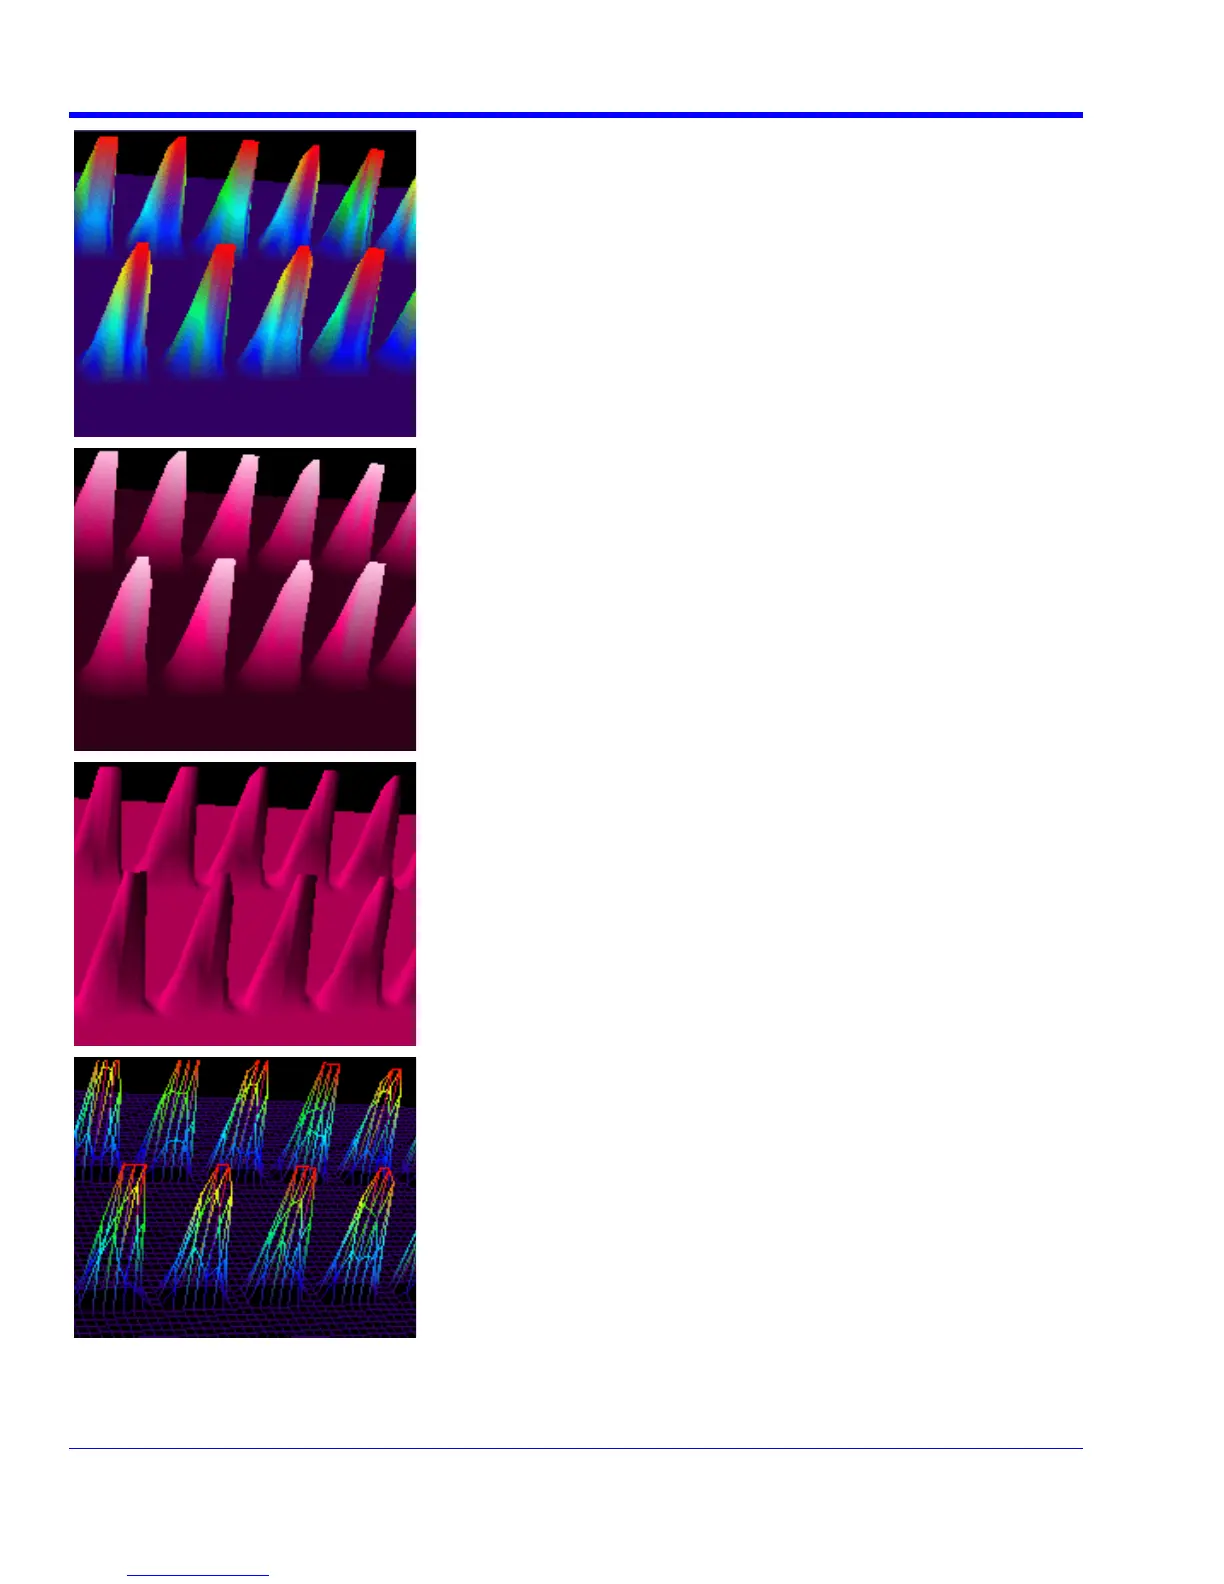
Here is an example of a 3-dimensional view of a square wave using the
h red solid view of color-graded persistence. Saturation is set at 50%, wit
areas indicating highest intensity. The X-axis has been rotated 60%; the
Y-axis has been rotated 15%.
Here is a monochrome (analog) view of the same waveform. The ligh
areas indicate highest intensity, corresponding to the red areas in the s
test
olid
view.
Here is a shaded (projected light) view of the same waveform. This view
emphasizes the shape of the pulses.
Here is a wire frame view of the same waveform in which lines of equal
intensity are used to construct the p
ersistence map.
74 WRXi-OM-E Rev C

 Loading...
