www.lynxspring.com
®
USER GUIDE
Lee’s Summit, MO 64086
sales@lynxspring.com
All Rights Reserved
Revised 2/1/2019
JENE-EG534-V2
Page 21 of 31
This dialog allows you to edit the current “source-to-results” non-linear curve used by the Proxy point, import another
curve (.xml file), or export (save) the current curve as an .xml file. In this way you can provide any custom non-linear
curve needed.
Figure 3-13 shows a point with a non-linear curve described in the “Non-linear sensor example” below.
The following notes apply to using this feature:
• A curve requires at least 2 points (rows), each using “Source” to “Results” values.
Source values use the “Device Facets” of the Onyxx Proxy point, and must be in the range of the
controller input. Therefore, if a
VoltageInputPoint, source values must be between 0V to 10V, or if a
ResistanceInputPoint, source values must be between 0 to 100000 (Ohms).
Result values are typically the measured value, regardless of units, at each source point. This assumes no
further scaling using a LinearCalibrationExt—i.e., its Scale property is the default “1”.
• Points are used in ascending order, by the Source column.
• Add as many points as is needed. There is no hard-coded limit. Click the Add button to add a new row for a
point.
• If a point is skipped, it can be added at the end. When finished, click Resort. This automatically reorders all
points in ascending order, by the Source column.
• Click the delete icon (trash can) beside any point to delete it from the curve. If the Delete All button is clicked,
all points (plus any Description text) is removed (typically, this is done only to enter a new non-linear curve).
• Description text appears in the ProxyExt property sheet, beside the Conversion edit icon.
• When Save is clicked, the curve configuration is stored as part of the conversion object in the station (there is
no association with any external file, in case you imported a non-linear curve).
Note: If you update a non-linear curve (say, add a point) after it was imported in one or more OnyxxPoints,
you need to export it (save) and re-import it in other points, in order for them to be updated.
Non-linear sensor example
You have a photo resistor-based illuminance sensor that measures light output from 0 to 800 lux, supplying a
resistance of 30K ohms to 3K ohms. Using a
ResistiveInputPoint, select the conversion type Generic Tabular,
and click the edit control for the Tabular Conversion Dialog (see
Figure 3-13 on page 20).
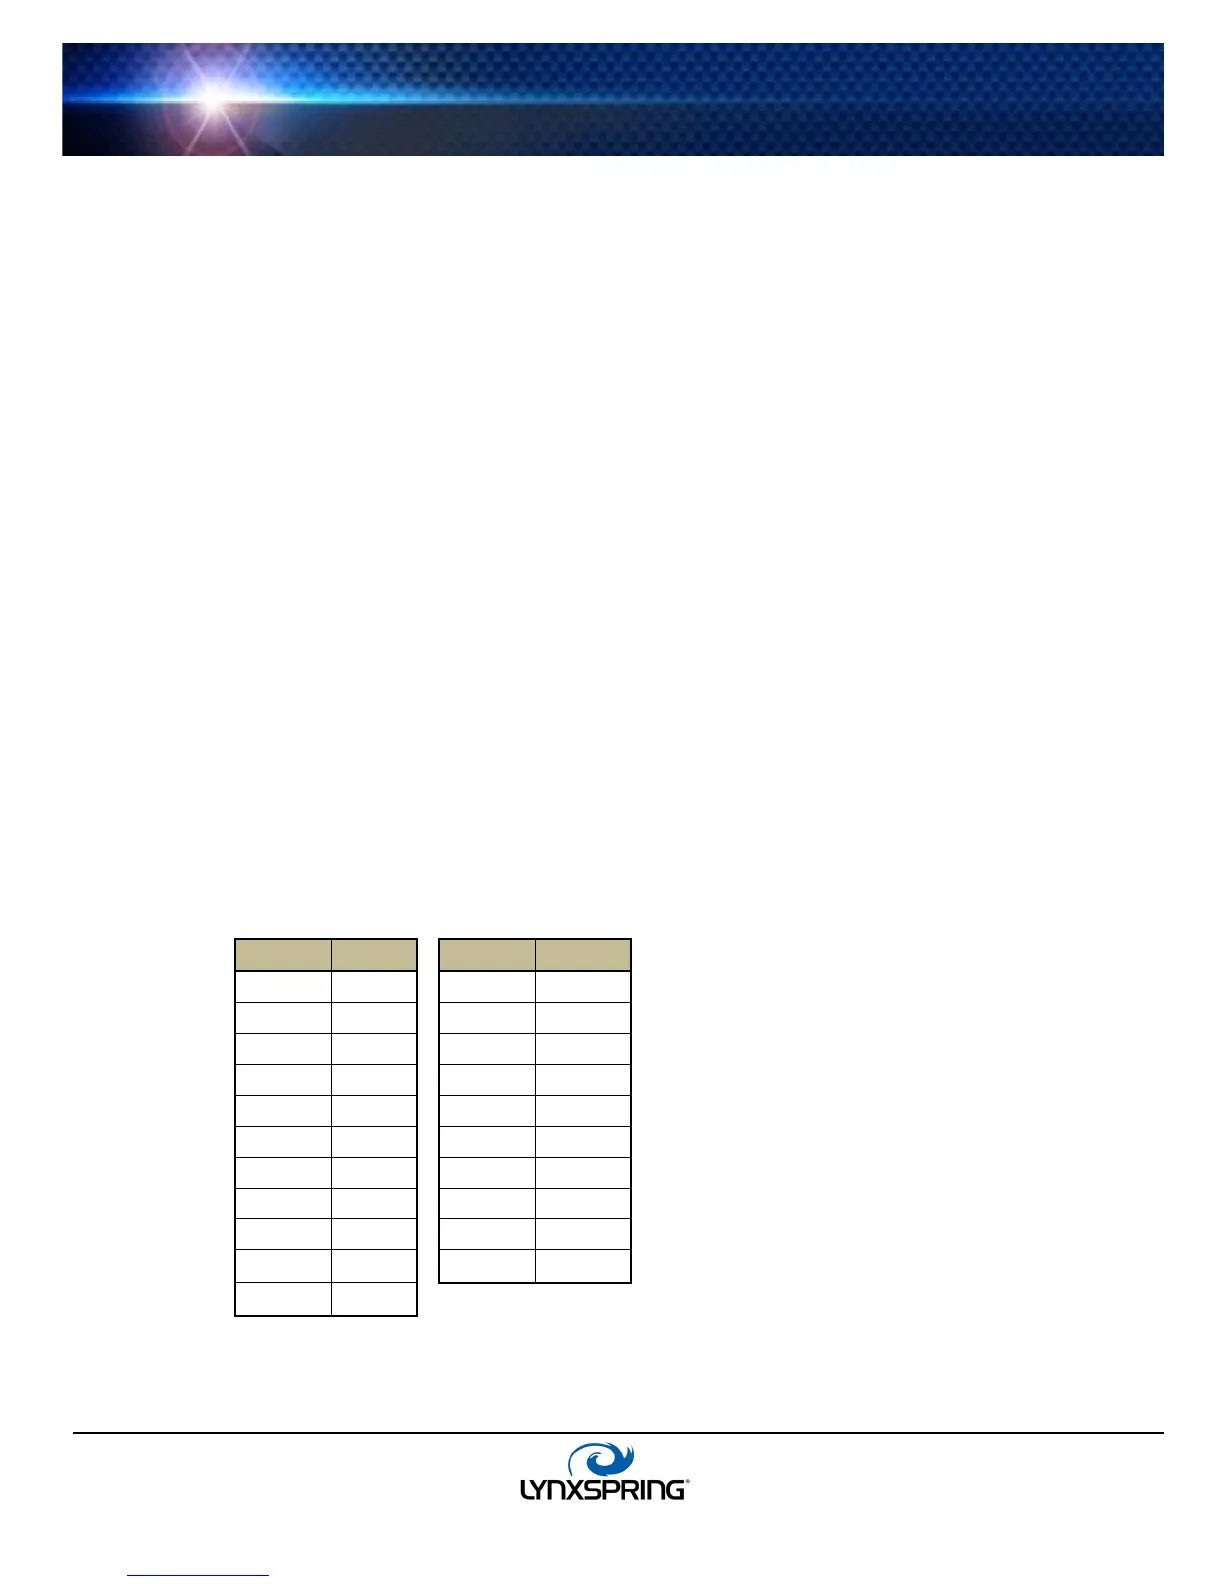
In the dialog, enter the sensor’s non-linear response curve (shown below). Configure this point’s facets to have
units: “illuminance,” “lux” (lx), and the same units in the point’s Linear Calibration Ext.
Table 3-1 Example illuminance sensor source (ohms) to results (lux)
Ohms Lux
Ohms Lux
 Loading...