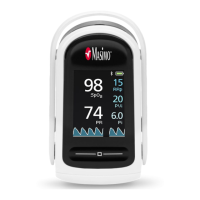
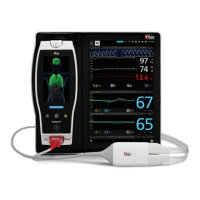
O3 Regional Oximeter Chapter 4: Operation
www.masimo.com 27 Masimo
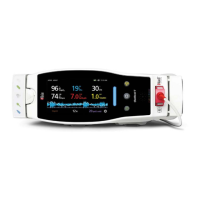
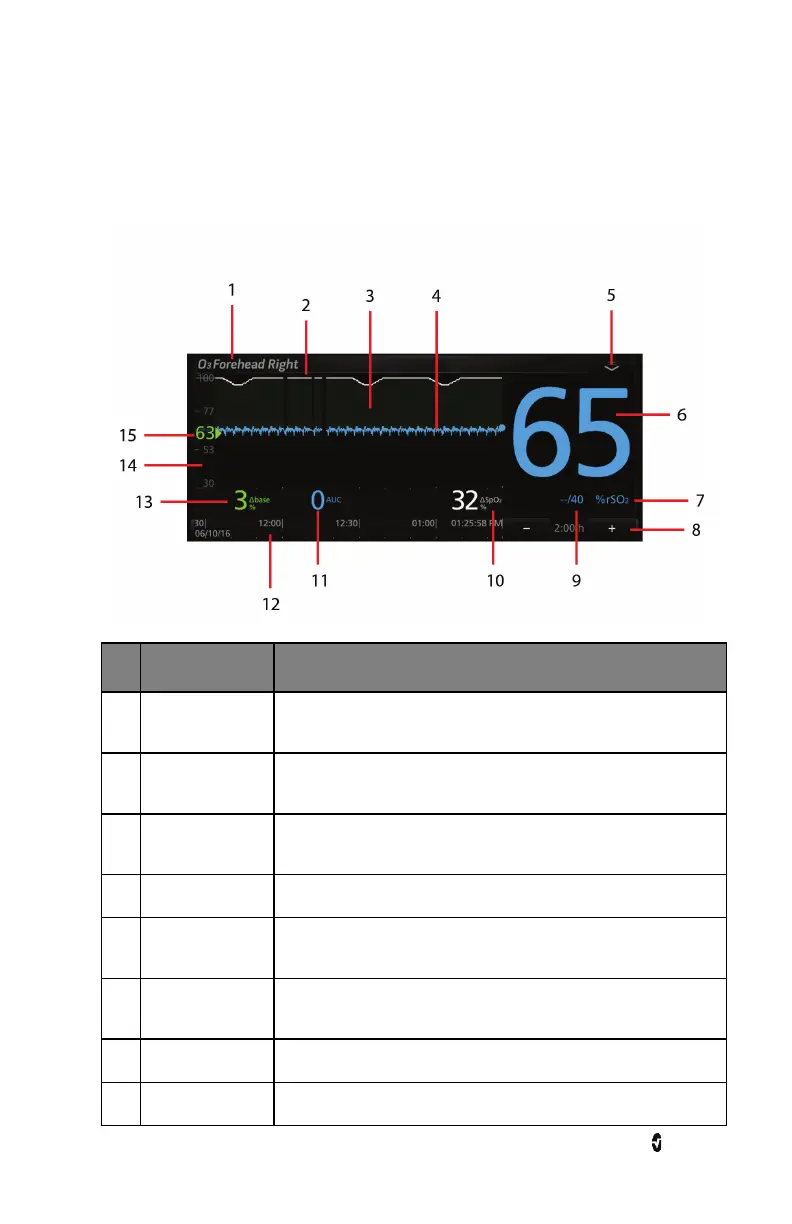
Each sensor display shows a multitude of information about O3 Module parameters and
measurements and also allows the user to customize how the information is displayed. The
various portions of a sensor display are outlined in the illustration and each portion is
explained in more detail in the table below.
Ref.
Feature Description
1 Sensor Label Label identifies the sensor site that corresponds to the application
site of the O3 Sensor.
2 SpO2 Trend Line Displays SpO2 level from the peripheral SpO2 sensor site over
time
1
.
3
ΔSpO2 Region
Displays the difference between levels of SpO2 (peripheral SpO2
sensor site) and rSO
2
of the O3 Sensor site over time.
4 rSO
2
Trend Line Displays rSO
2
level of the O3 Sensor site over time.
5 Drop-down Menu Allows user to change display options and access the site selection
and set baseline menus for each O3 Sensor.
6 rSO
2
Value Indicates the current rSO
2
level of the O3 Sensor site. Press the
value to access the rSO
2
menu.
7 %rSO
2
Indicates the unit of measurement for rSO
2
.
8 Time Frame Displays the current time frame of trending shown.