22
|
EN / SunMaster CS15TL RP / CS20TL RP / CS30TL RP
Before showing accurate information, the StringMaster
measurements must be configured in the StringMaster
Settings menu. Refer to section 8.10.9 for additional
information.
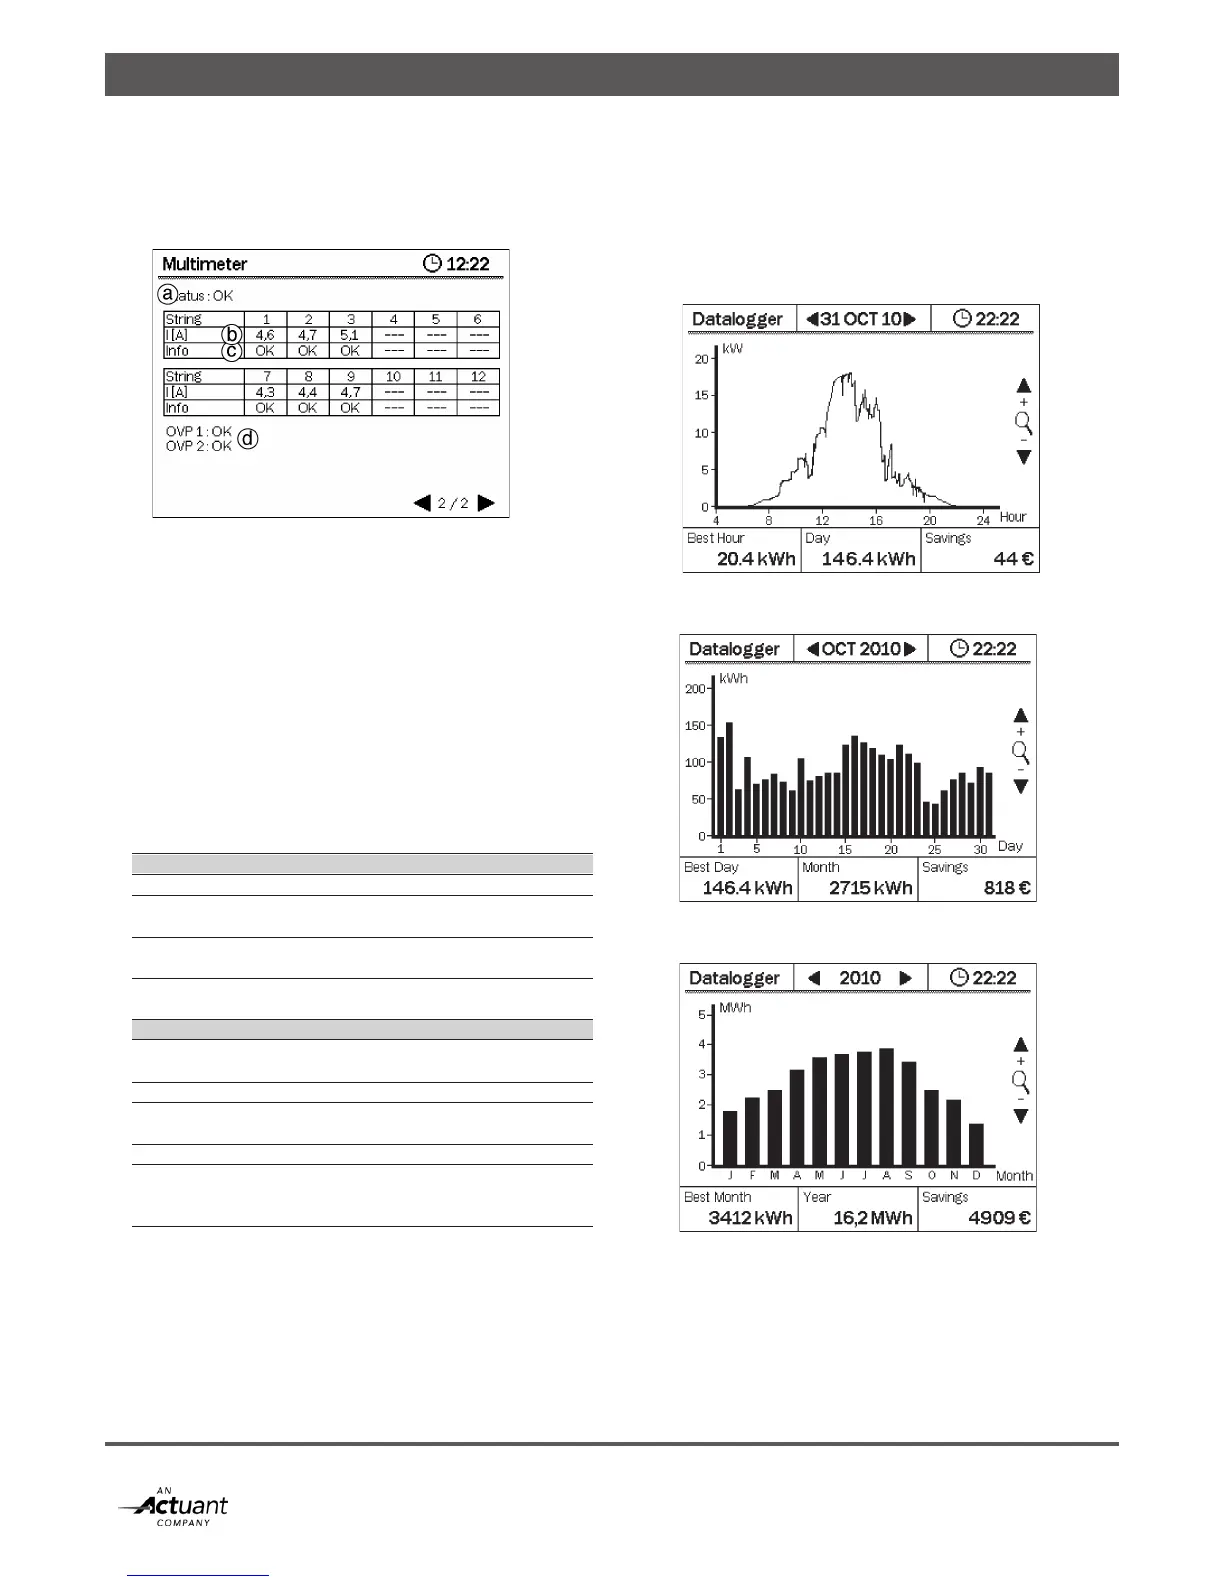
Figure 8-11: Multimeter inputs per string
The StringMaster screen provides the following information:
a. StringMaster Status. Refer to the table below for
status information.
b. String Current. The current measured for each string.
c. String Info. Monitoring information for that particular
string. Refer to the table below for status information.
d. OVP Status. Trip status of the Surge Protectors inside
the StringMaster.
If the StringMaster is not connected or has an error, some or
all items may show three dashes (---) instead of a value. The
table below shows the Status and String info messages and
their meaning.
StringMaster Status Information
OK StringMaster is ON and operating normally
ALARM StringMaster has detected a problem in
the PV installation
ERROR StringMaster has an internal error or has
lost communication
Not Connected StringMaster is not connected
(and has not been connected previously)
StringMaster String Info
--- String is not configured, StringMaster has
an error or is not connected
OK String is healthy
OC String has exceeded maximum current
of 30A
NEG String current is reversed
LOW String current is below PV array
performance. See section 8.9.9 to
configure health monitoring
8.7 DATALOGGER
Every SunMaster CS inverter is fitted with an internal
Datalogger that allows the user to track the inverter
performance over the past. The datalogger can store energy
data for up to 10 years with adaptive resolution. With
adaptive resolution, energy data becomes more summarized
when looking further back in the past:
• Day-to-day energy shows a 10-minute accurate prole of
the energy generated for the past 30 days.
• Month-to-month energy shows the daily energy yield for
the past 12 months.
• Year-to-year energy shows the monthly energy yield for
the past 10 years.
Figure 8-12: Datalogger, day-to-day energy.
Figure 8-13: Datalogger, month–to-month energy.
Figure 8-14: Datalogger, year- to-year energy.
Use the buttons to navigate through the datalogger
information. LEFT/RIGHT will select the next/previous day,
month or year. UP will zoom in, increasing the resolution,
DOWN will zoom out, showing a larger timespan. The BACK
button will return the display to the Main Menu. In the bot-
tom of the Datalogger screen, some statistics are shown: