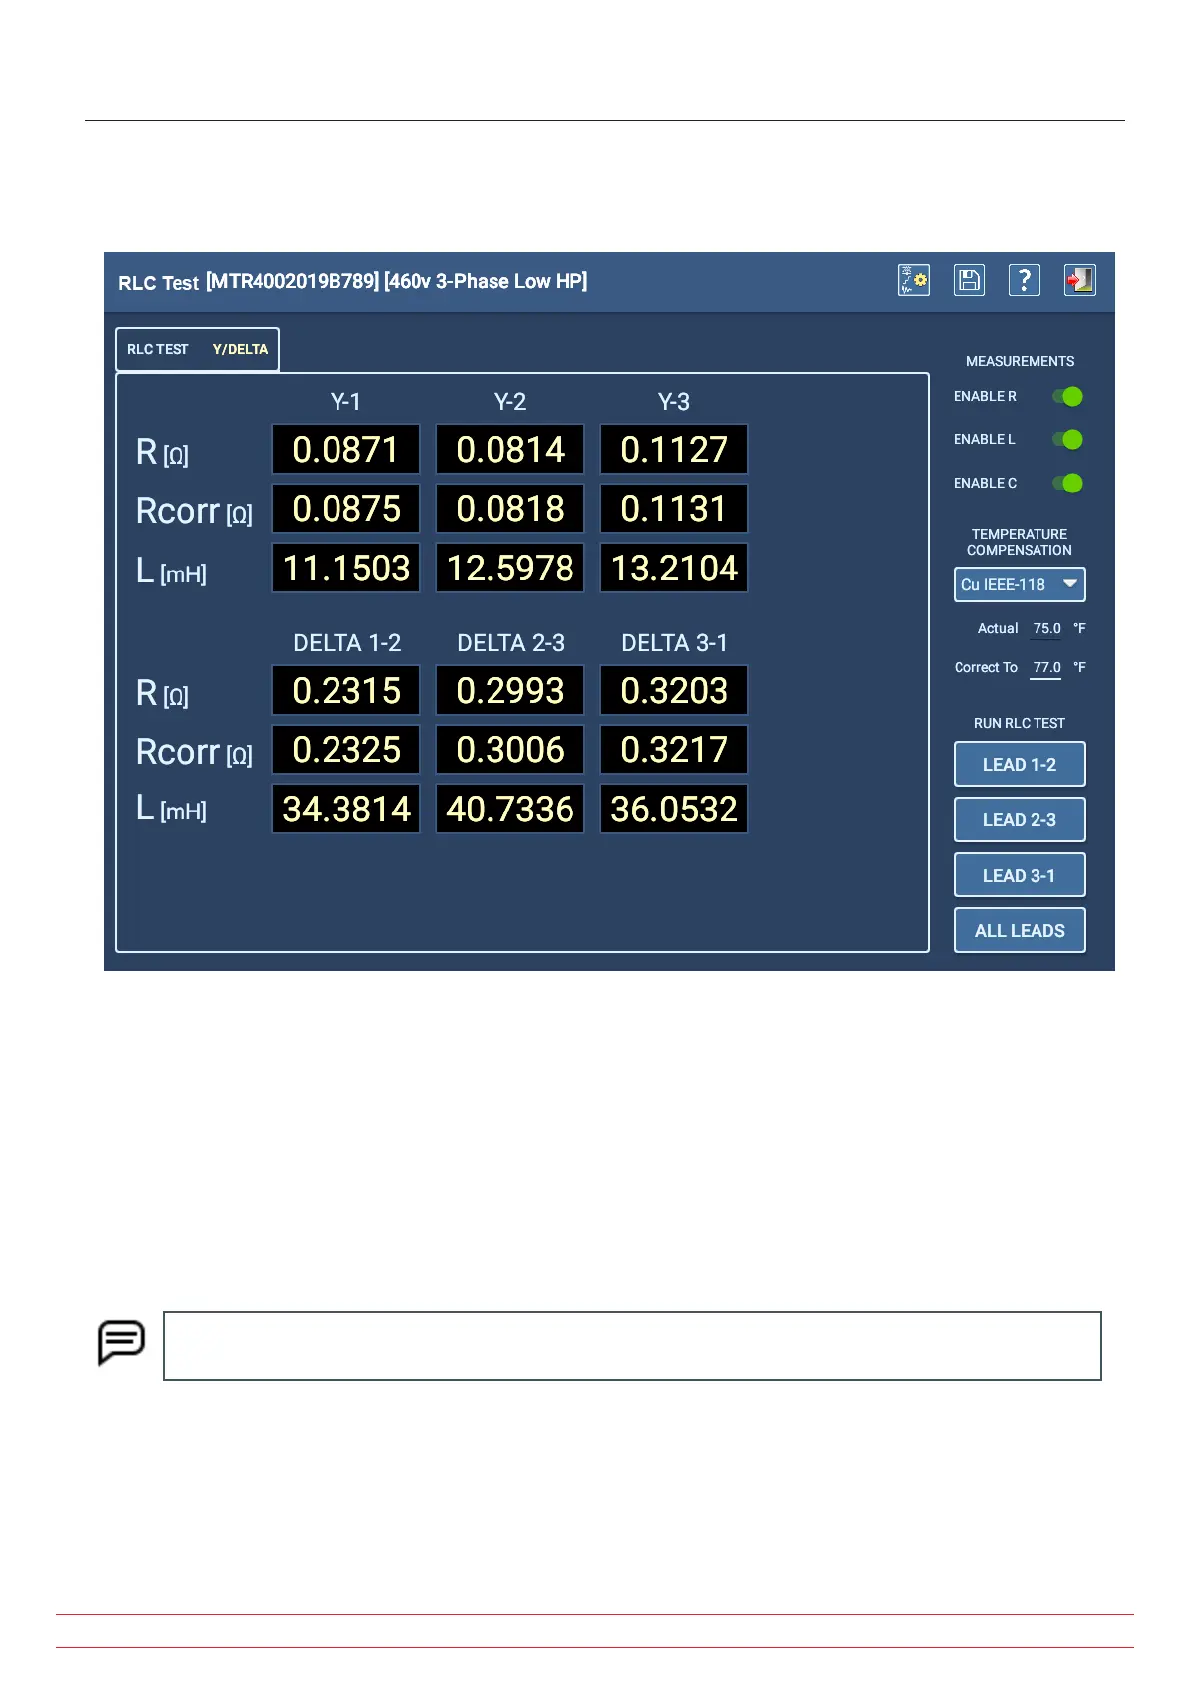
6. You can use the Y/Delta tab to view additional test details that can help you identify which winding is causing the
test to fail. After all three L-L values are directly measured, a software algorithm calculates the values for each phase
in both wye and delta configurations for the motor, and presents them in this tab.
Fig 82: Manual Test—RLC Y/Delta tab.
One example for how this information might be used is troubleshooting to identify a faulty component.
In an ideal motor, all three windings are equally balanced. In a faulty motor, the L-L measurements can show two
higher resistance values, but only one phase might be bad because the faulty phase is actually attached to two of the
L-L leads; two L-L readings are high and one is not.
With the software showing the calculated results for each phase, you can see that one is reading high, but because
of the winding configuration, the “bad” phase affects two of the L-L measurements. By looking at each phase value
presented in this tab, you can identify the problem component. These values should be compared to the motor
specification values to confirm that the one “bad” phase is indeed the culprit, and the other two are good.
NOTE: The preceding is only one potential example of how this screen and its data could be used. Other
factors can exist that would change how you should interpret the data presented.
www.megger.com
Megger Baker ADX User Guide
86
Manual Tests
 Loading...