kajaaniMCA
i
– Installation, Operating & Service - 7.3 - W4610201 V2.5 EN
F7
F6
F5
F4
F8
F3
F1
F2
F9
F10
F11
F12
F13
F14
F15 F16
i
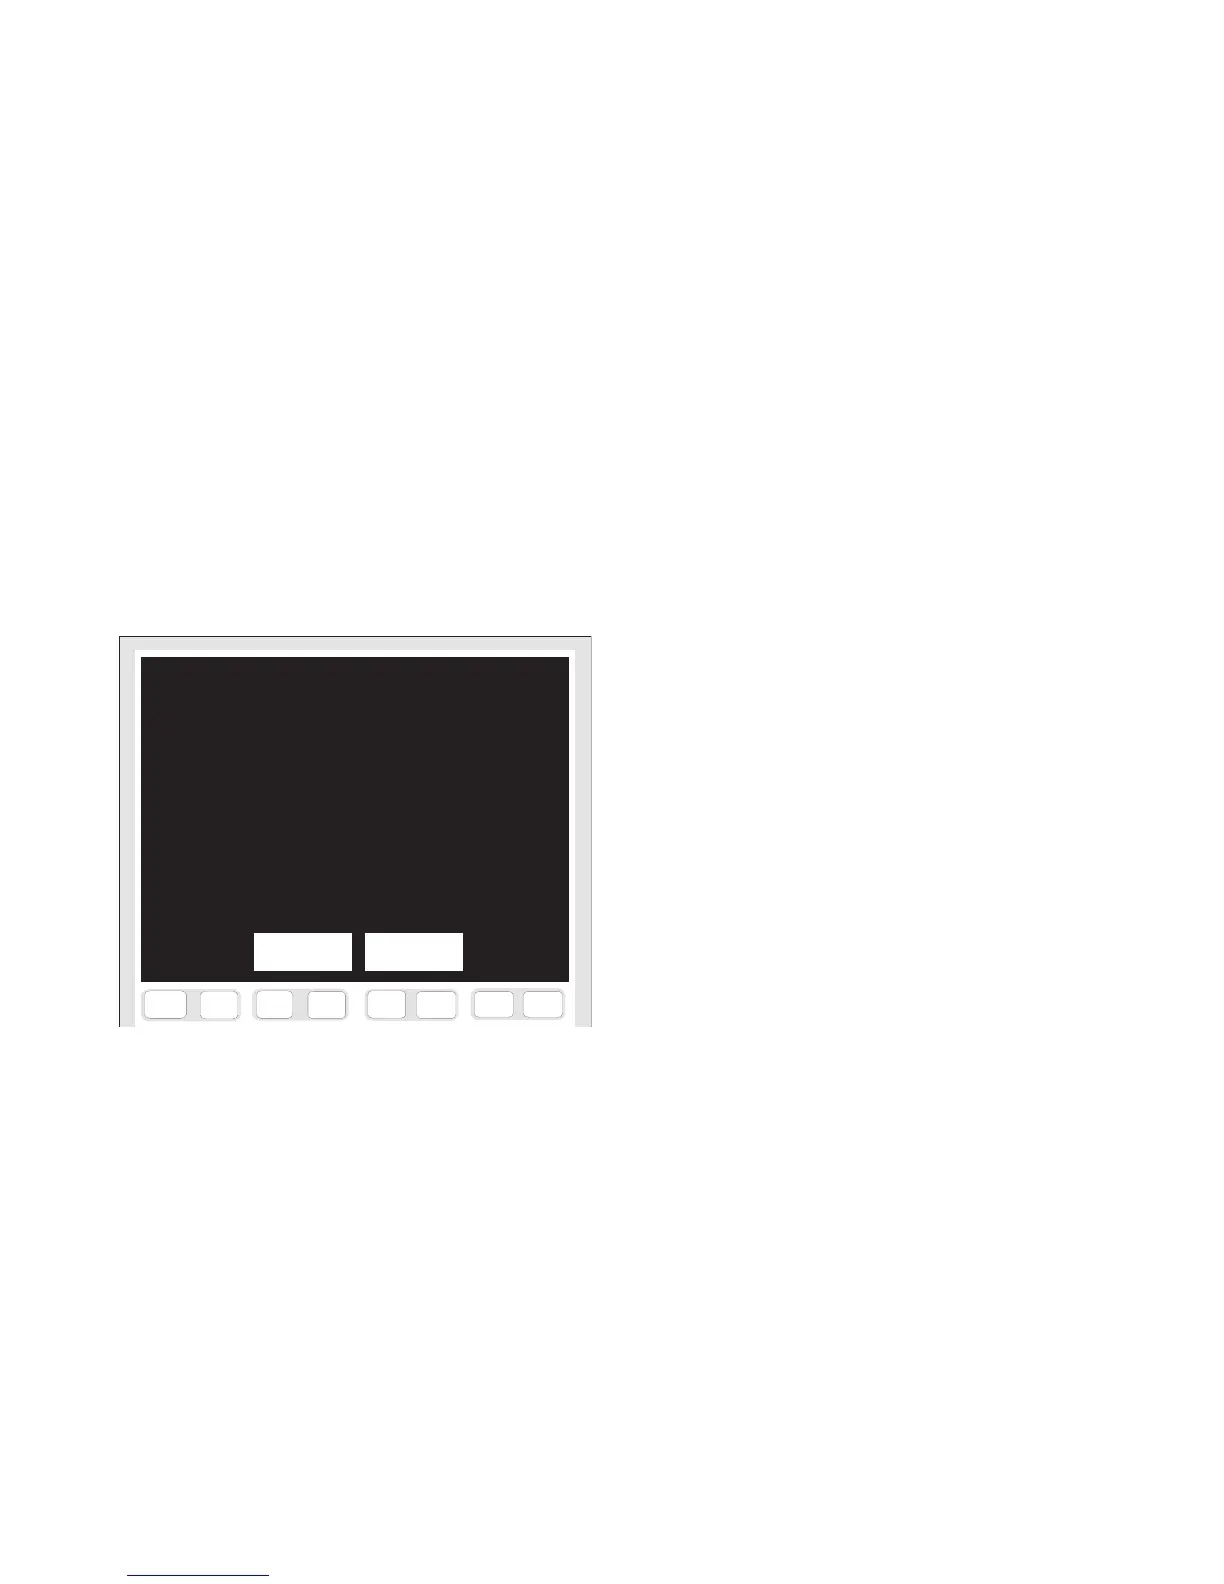
Fig. 7.5. “Sample history” display.
Sample history
Sample MCAi Lab Temp Mlev Rlev
Ccom
% % °C u V %
18.10.00
10.17 3.38 3.20 69.7 59.07 1.618 0.00
17.10.00
10.23 3.20 3.20 68.7 58.50 1.636 0.00
17.10.00
09.17 3.10 3.20 67.7 58.01 1.620 0.00
Page Enter
backwards lab
7.C.2. Sample history
Go from MAIN MENU => ENTER LAB => SAMPLE HISTORY
(Fig. 7.5).
The taken samples are stored in the history table,
arranged according to the date of sampling. The display
shows the following data:
• Sample: date and time of sampling.
• MCAi %: measured process consistency.
• Lab %: laboratory consistency used in calibration.
• Temp °C: temperature in the process.
• Mlev u: signal level of the measurement channel at
this consistency.
• Rlev V: signal level of reference channel (u).
• Ccom %: chemical compensation value.
Using the “Sample history” display, the Lab. value
of any sample can be edited also afterwards. To edit the
laboratory value, press [F5&F6] E
NTER LAB.
Use keys [F3&F4] P
AGE BACKWARDS and [F1&F2]
P
AGE FORWARDS to scroll the history table back and forth.
 Loading...