kajaaniMCA
i
– Installation, Operating & Service - 9.1 - W4610201 V2.5 EN
9. Special Functions
9.A. Special Functions
Go from M
AIN MENU => SELFDIAGNOSTICS => SPECIAL
FUNCTIONS
(Fig. 9.1).
The “Special functions” menu contains functions
for chemical content and temperature compensation,
filler content, sampling, recipes, and sensitivity coeffi-
cient.
• Chemicals compensation is needed if large varia-
tions occur in the chemicals content of the process.
• Temperature compensation can be applied to correct
the measurement, section by section, using a linear
curve. This correction is needed if the process
temperature may go below 30°C (86°F).
• The filler content information can be connected to
the sensor as an analog signal, the sampling infor-
mation as a binary signal.
• The recipe function can be used in cases when the
process conditions vary so much that one calibration
cannot cover the entire range.
• The sensitivity coefficient function can be applied to
change the Cs sensitivity of the MCAi sensor.
The last two functions are mainly needed in applica-
tions outside the pulp & paper industry.
NOTE: The last two functions are normally not visible in
the menu – to display them, press 0 (zero)!
9.B. Chemicals compensation
9.B.1. Principle
Large variations in the chemicals content of the pulp
affect the measurement of microwave propagation time.
As a result, the MCAi will show a too high reading
when the chemicals content increases. Chemicals also
affect the attenuation of the microwave signal, causing
a lower signal level result (u). Thus there is a correlation
between the consistency error (MCAi – Lab. value) and
the measured signal level. Based on this correlation, the
Cs measurement error caused by the chemicals content
can be eliminated by applying the correct chemicals
compensation factors.
If large variations occur in the chemicals content of
the process, the consistency, signal level and tempera-
ture measured by the MCAi should be included in the
laboratory follow-up, as well as the conductivity and
consistency measured in laboratory. Based on the col-
lected data, the signal level measurement can be cor-
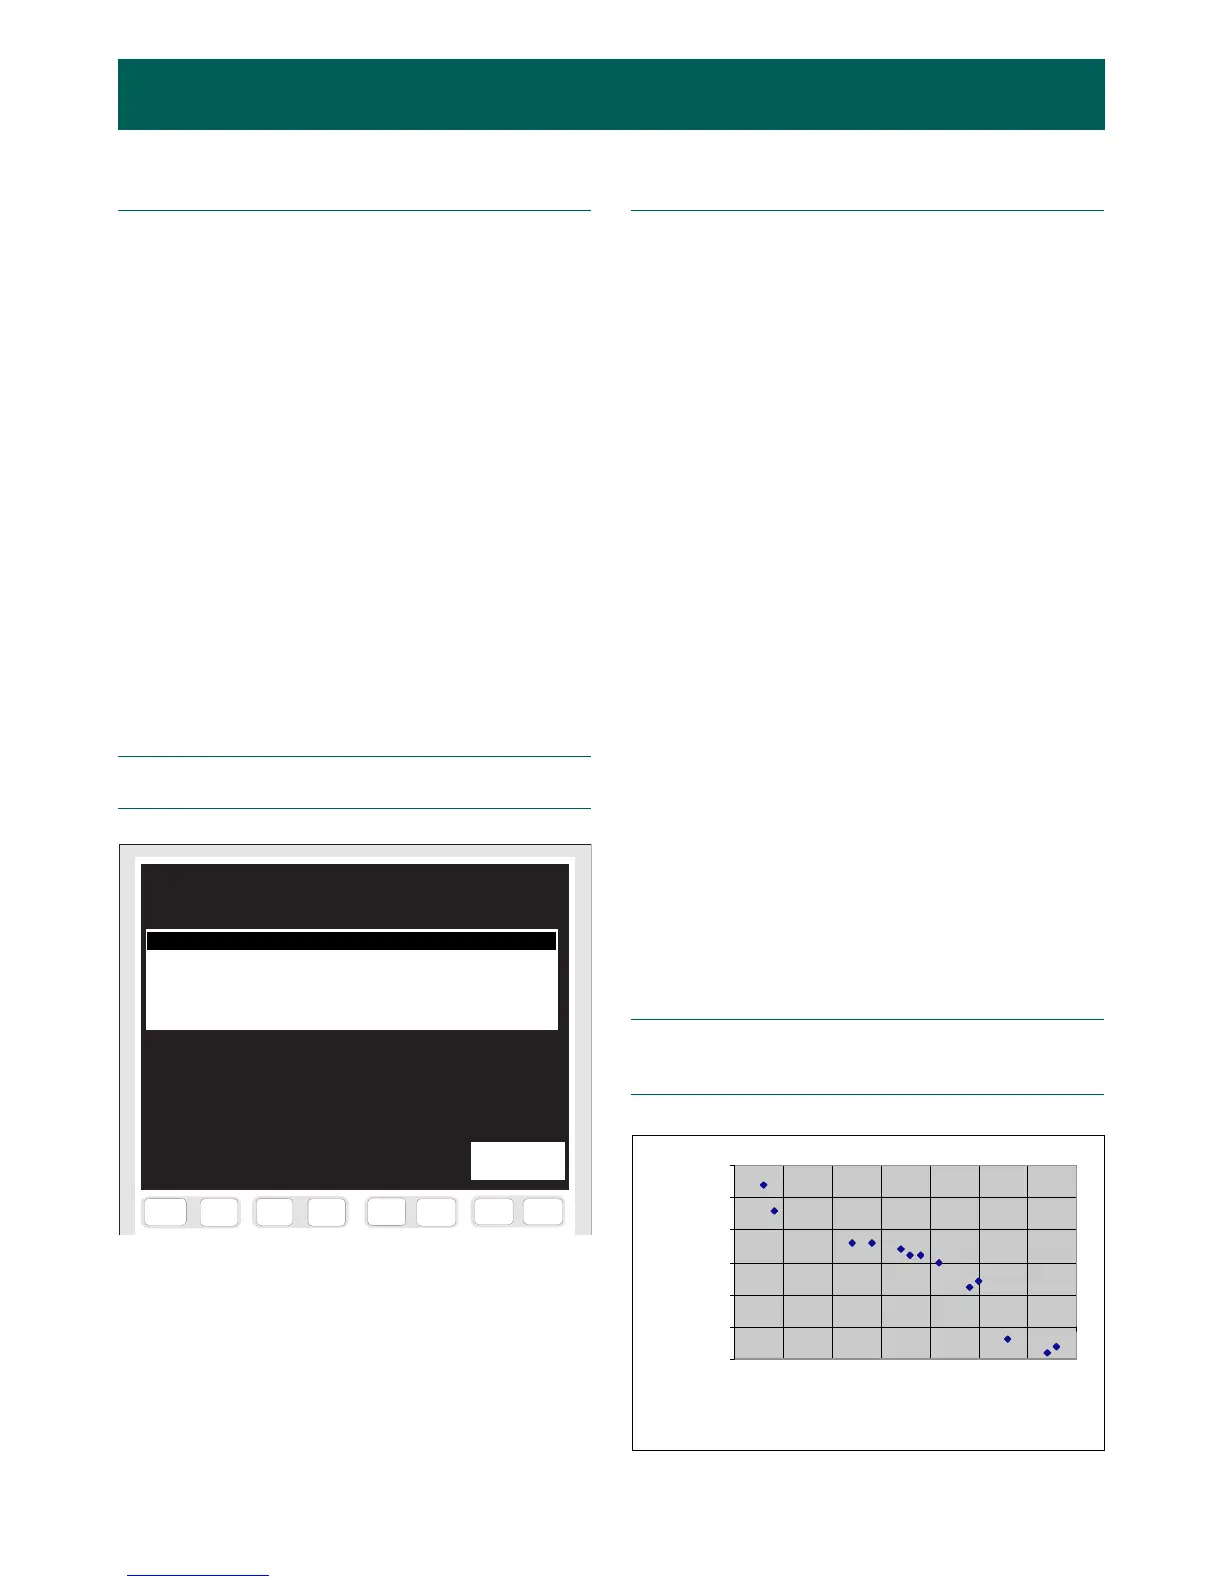
rected by chemicals compensation if needed. Fig. 9.2
shows an example graph based on laboratory follow-up
results; in the graph the consistency error (MCAi –
Lab.) is on the Y-axis, signal level on the X-axis. Mlev
is the abbreviation used for the MCAi signal level.
As the graph shows, the consistency error (MCAi –
Lab) correlates with the signal level. This indicates that
the error is caused by chemicals and thus it can be
eliminated by chemicals compensation. To make sure,
we can make a graph with conductivity (reflecting the
chemicals content) is on the X-axis. The graph should
then be a rising straight line; the error (MCAi – Lab.)
grows when conductivity increases.
Chemicals compensation is determined by means of
two-point calibration.
NOTE: Select the calibration points so that the differ-
ence between their chemicals contents and signal levels
is as great as possible.
F7
F6
F5
F4
F8
F3
F1
F2
F9
F10
F11
F12
F13
F14
F15 F16
i
Special functions
Chemical compensation
Temperature compensation curve
Filler contents: analog input
Sample taking: binary input
Recipes
Sensitivity coefficient
ENTER =
Open
Fig. 9.1. “Special functions” menu.
Fig. 9.2. Correlation of Cs error to signal level.
-0.05
0
0.05
0.1
0.15
0.2
0.25
35 40 45 50 55 60 65 70
Mlev (u)
MCAi - Lab (%)
 Loading...