kajaaniMCA
i
– Installation, Operating & Service - 8.1 - W4610201 V2.5 EN
8. Data Collection
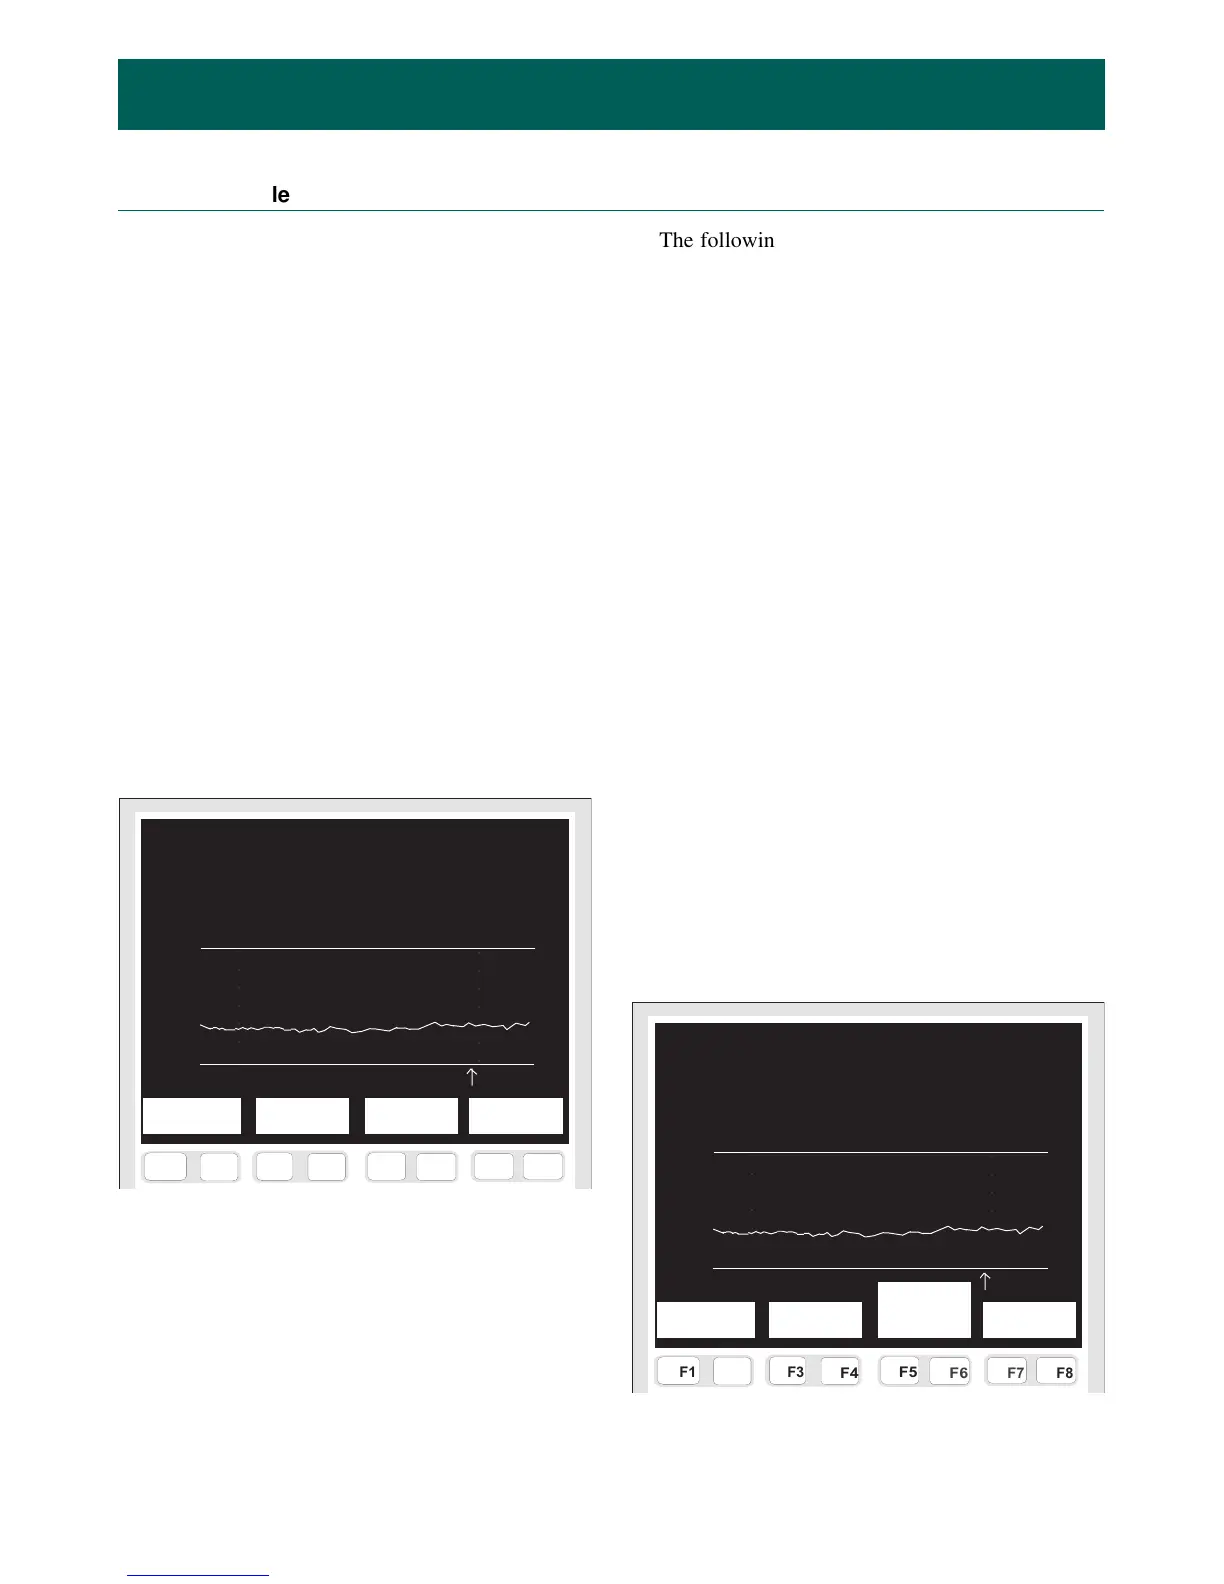
MAIN MENU => SELFDIAGNOSTICS => TREND TABLE (Fig.
8.1).
The MCAi stores measurement results in a trend
table which can be scrolled using this display. The
display shows a graph of the selected measurement
result, and other measured values from the ongoing
measurement. Use the LEFT/RIGHT arrow keys to
move the small arrow cursor shown in the bottom of the
graph; this cursor always points at one measurement
point for which the data is shown on the screen. Use the
UP/DOWN arrow keys to move the cursor to the left or
right, 10 measurements at a time. The following data is
shown on the screen:
• Start: starting time of graph.
• Stop: end time of graph.
• Cursor: measurement time and Cs result indicated
by the arrow cursor.
• Trend interval: the measurement is carried out at
set intervals (default: every 10 minutes). Note that a
shorter trend interval will also shorten the time that
the table covers.
• Length: size of the trend table.
F7
F6
F5
F4
F8
F3
F1
F2
F9
F10
F11
F12
F13
F14
F15 F16
i
TREND TABLE Trend interval:
Start: 20.09 12:33 010
minutes
Stop: 20.10 13:10 -> length:
Cursor: 20.10 13:10 40.67 days
5.41
MCA Temp Mlev Rlev Drift Rst Mst Chem
5.41 63.6 58.9 1521 3.7 0.4 0.9 0.00
11.11
0.00
MCA
Graph Interval Page Page
settings backwards forwards
Fig. 8.1. “Trend table” display.
○○○○○○○
○○○○○○○
F7
F6
F5
F4
F8
F3
F1
F2
F9
F10
F11
F12
F13
F14
F15 F16
i
TREND TABLE Trend interval:
Start: 20.09 12:33 010
minutes
Stop: 20.10 13:10 -> length:
Cursor: 20.10 13:10 40.67 days
5.41
MCA Temp Mlev Rlev Drift Rst Mst Chem
5.41 63.6 58.9 1521 3.7 0.4 0.9 0.00
11.11
0.00
MCA Enter
Select y-scale
variable (auto)
Fig. 8.2. “Trend graph settings” display.
○○○○○○○
○○○○○○○
8.A. Trend Table
The following measured values will be shown for
the time indicated by the cursor:
• MCA: measured process consistency (%).
• Temp: process temperature (°C or °F).
• Mlev: signal level of measurement channel (u).
• Rlev: signal level of reference channel (u).
• Drift: compensation for electronics drifting.
• Rst: stability of reference channel.
• Mst: stability of measurement channel.
• Chem: chemical compensation value.
• Cabin: temperature inside the electronics housing
(can be displayed by changing the trend variable; see
section 8.A.1).
Thus the trend interval shows the measurement
interval for the sensor. Press [F3&F4] I
NTERVAL to edit
the trend interval setting. Enter the required value and
press [F7&F8] S
AVE.
Use keys [F5&F6] P
AGE BACKWARDS and [F7&F8]
P
AGE FORWARDS to scroll the table back and forth.
8.A.1. Graph settings
Go from MAIN MENU => SELFDIAGNOSTICS => TREND
TABLE
=> GRAPH SETTINGS (Fig. 8.2).
This display allows you to change the trend table
variable shown on the Y-axis. Press [F3&F4] S
ELECT
VARIABLE
to change the variable shown on the Y-axis.
Press [F5&F6] E
NTER Y-SCALE to change the Y-axis
scaling; either give the low and high limits manually, or
let the software do the scaling. Finally press [F7&F8]
to save changes.
 Loading...