kajaaniMCA
i
– Installation, Operating & Service - 12.11 - W4610201 V2.5 EN
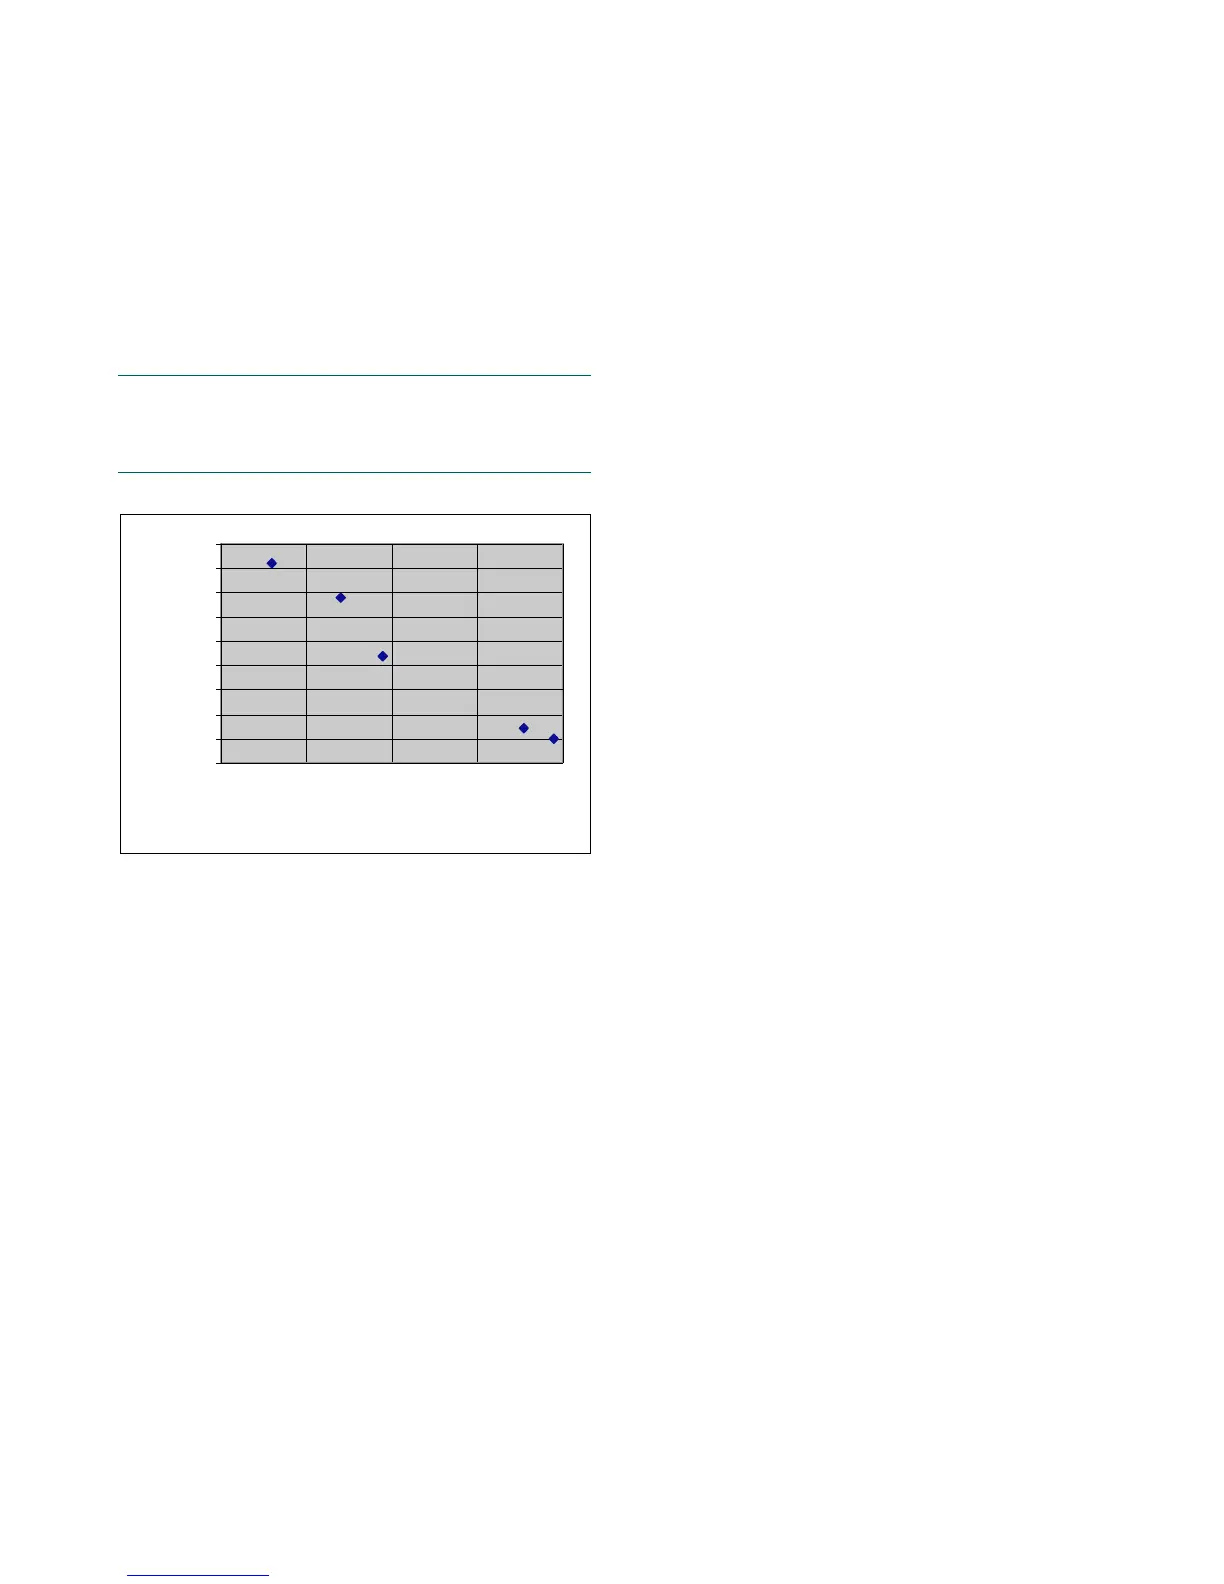
• Example 2.
The process temperature is in the range 20...25°C
(68...77°F), and thus errors in the temperature compen-
sation can be expected. The obtained “MCAi – Lab. Cs
vs. Temperature” curve, based on laboratory results, is
shown in Fig. 12.17.
In this case two points are sufficient to determine the
temperature effect. Use for example the points 20°C =
0.2% and 25°C = -0.1%, and enter them to the sensor as
described in the previous example.
NOTE: Make sure that you use the same “MCAi – Lab”
value for the last two points! Otherwise the correction
curve will continue using the slope between the last two
points.
-0.15
-0.1
-0.05
0
0.05
0.1
0.15
0.2
0.25
0.3
17 19 21 23 25
Temp. (°C)
MCAi - Lab (%)
• Adjusting the temperature compensation curve
To change the temperature compensation, edit the
existing curve. In this mode you can edit the existing
values, add new point pairs (max. 6 pairs), or delete a
point by setting its temperature and MCAi – Lab values
to zero.
Fig. 12.17. Effect of temperature on consistency error.
 Loading...