Debugger Funcon Summary
User Guide
© 2023 Microchip Technology Inc. and its subsidiaries
DS-50003529B - 81
It is possible to perform a debug session when the RSTPINCFG is congured to GPIO, but the pin will
be temporarily congured as UPDI, and the pin will not operate as a GPIO pin.
Table 9-12. SYSCFG0 RSTPINCFG[1:0] Conguraon Bits
Values Function
0x0 GPIO
0x1 UPDI
0x2 RESET
0x3 Reserved
9.2.10 Tool Pack Selecon
Select to use the latest tool pack or a dierent version to support the project device.
Table 9-13. Tool Pack Selecon Opon Category
Tool pack update options Use latest installed tool pack (recommended) - use the latest tool pack version installed.
Use specic tool pack - select from a list of other available tool pack versions.
Specically selected version Click here to pop up a dialog with a list of tool pack versions to select.
9.3 Debugger Windows & Dialogs
The following topics show windows and dialogs that are used specically for the debugger or other
related debug tools.
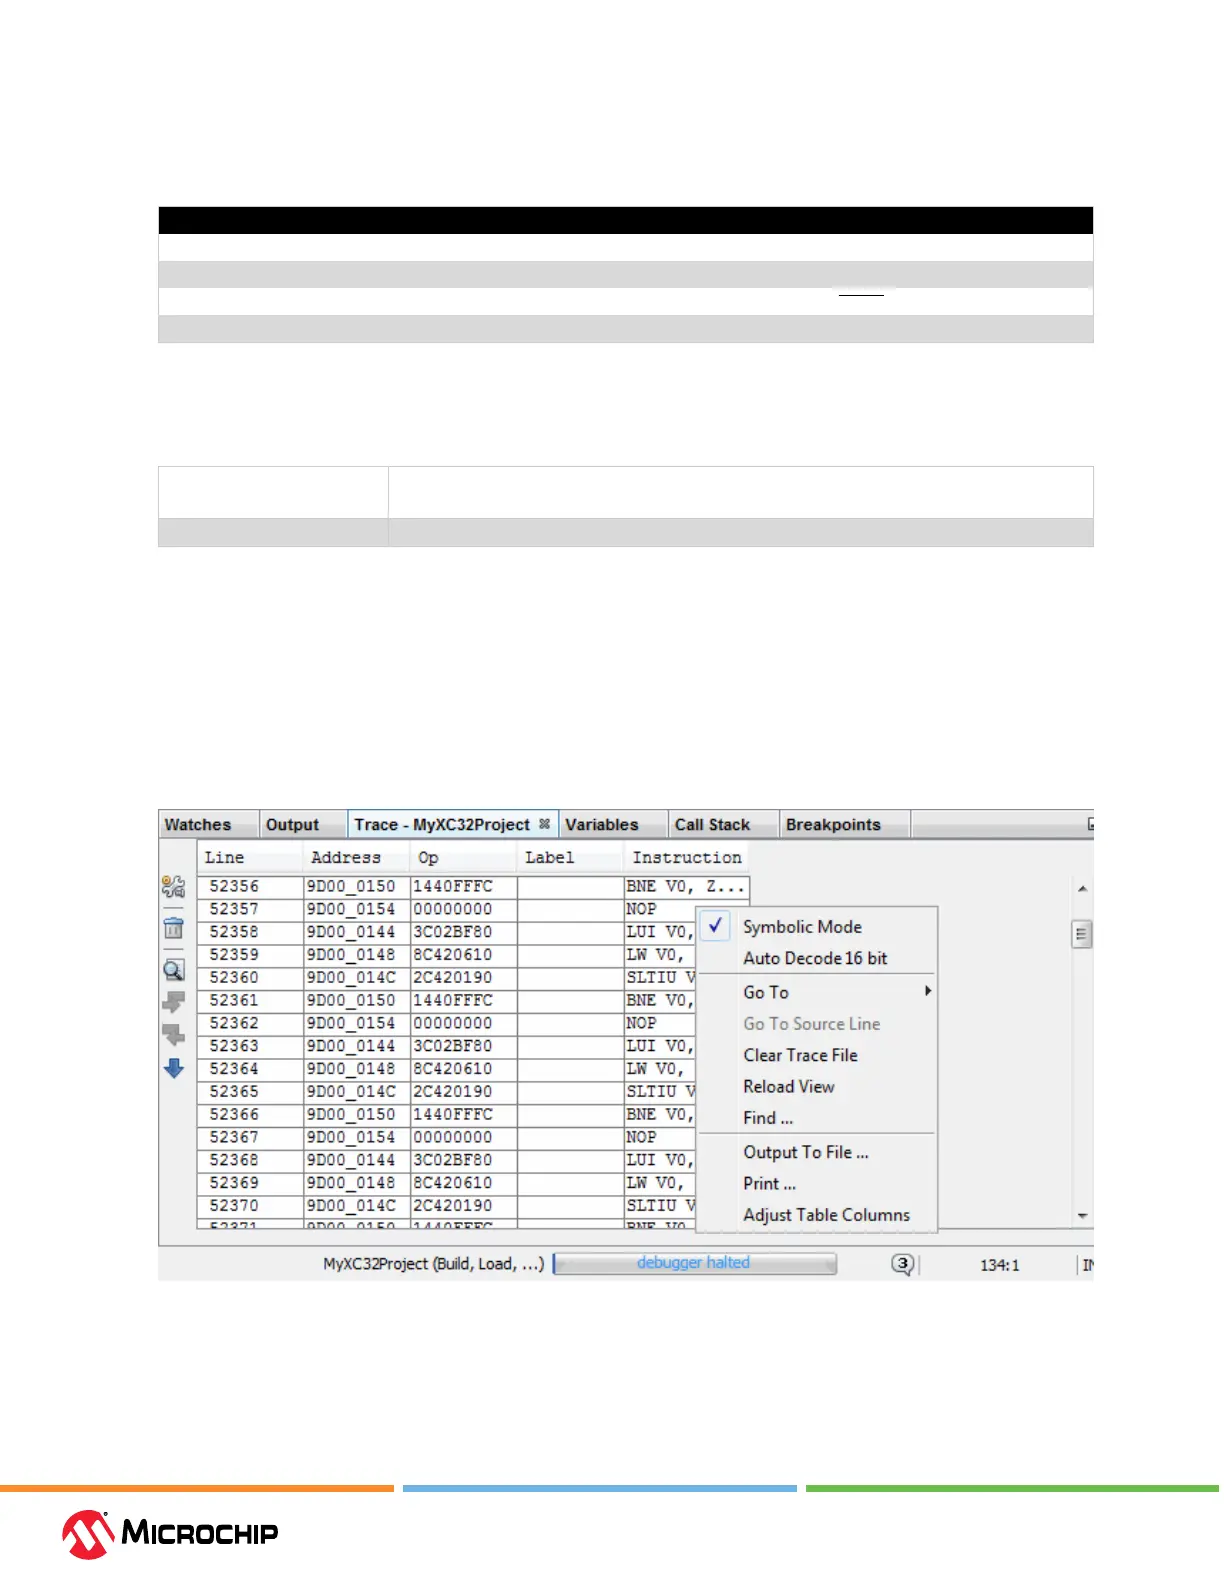
9.3.1 Trace Window and Related Dialogs
The trace window displays the results of a trace. This window is available for the debugger and the
simulator.
Figure 9-2. Trace Window
Right clicking in a column of the window shown above will pop up a menu with a list of functions. For
more on these functions, see the MPLAB X IDE User’s Guide/Help le, “MPLAB X IDE Windows and
Dialogs,” “Trace Window.”