Debugger Features
User Guide
© 2023 Microchip Technology Inc. and its subsidiaries
DS-50003529B - 56
5.5 SAM (ARM) - Trace and Proling
The SAM D5x/E5x Cortex-M4 processors implements a complete hardware debug solution. This
provides high system visibility of the processor and memory through a 2-pin Serial Wire Debug
(SWD) port that is ideal for microcontrollers and other small package devices.
5.5.1 ARM Cortex-M4 Processor - Trace and Proling
For system trace the processor integrates an Instrumentation Trace Macrocell (ITM) alongside data
watchpoints and a proling unit.
To enable simple and cost-eective proling of the system events these generate, a stream of
software-generated messages, data trace, and proling information is exported over two dierent
ways:
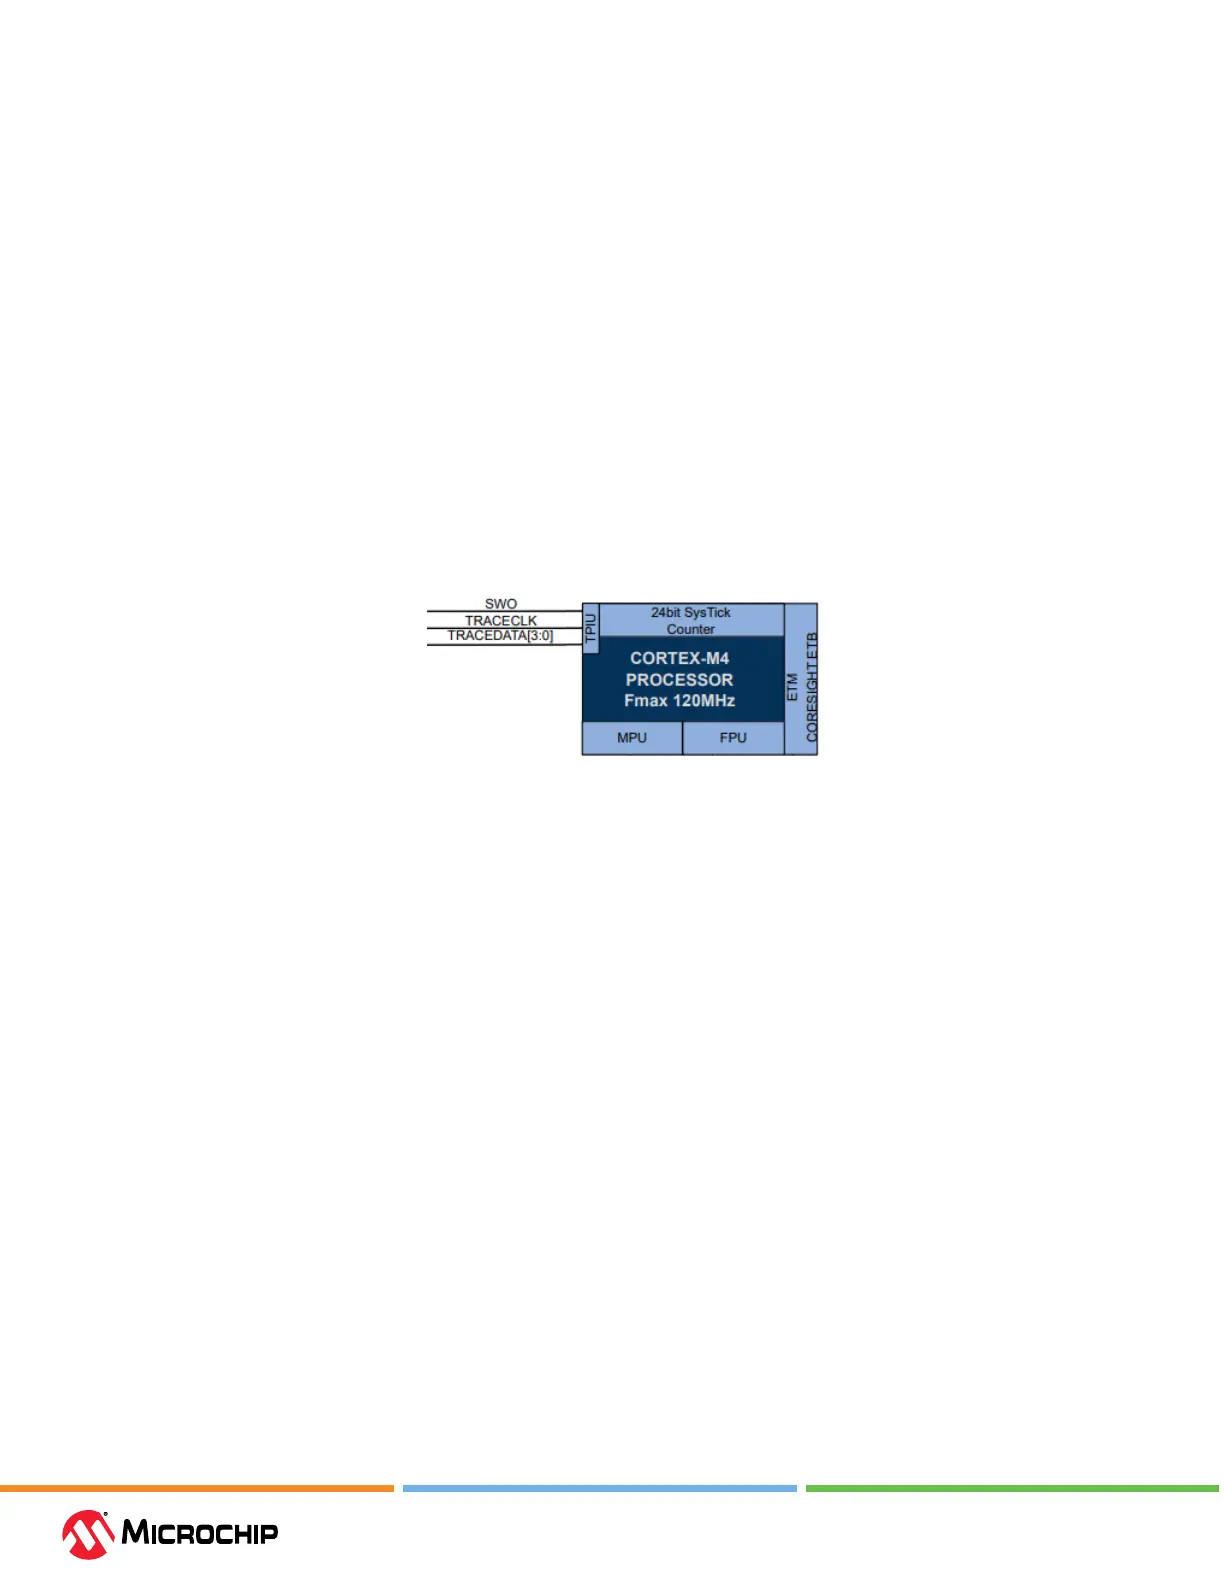
• Output o chip using the TPIU - through a single pin, called Serial Wire Viewer (SWV). Limited to
ITM system trace.
• Internally stored in RAM - using the CoreSight ETB. Bandwidth is then optimal but capacity is
limited.
Figure 5-6. Block Diagram
SWV trace data are output on the Serial Wire Output (SWO).
5.5.2 SAM D5x/E5x - ETB Connecon
When enabled, the bottom 32 KB system memory space is reserved for CoreSight ETB debug usage.
The gure below shows an example where both error correction codes (ECC) and CoreSight ETB are
enabled.