Debugger Features
User Guide
© 2023 Microchip Technology Inc. and its subsidiaries
DS-50003529B - 58
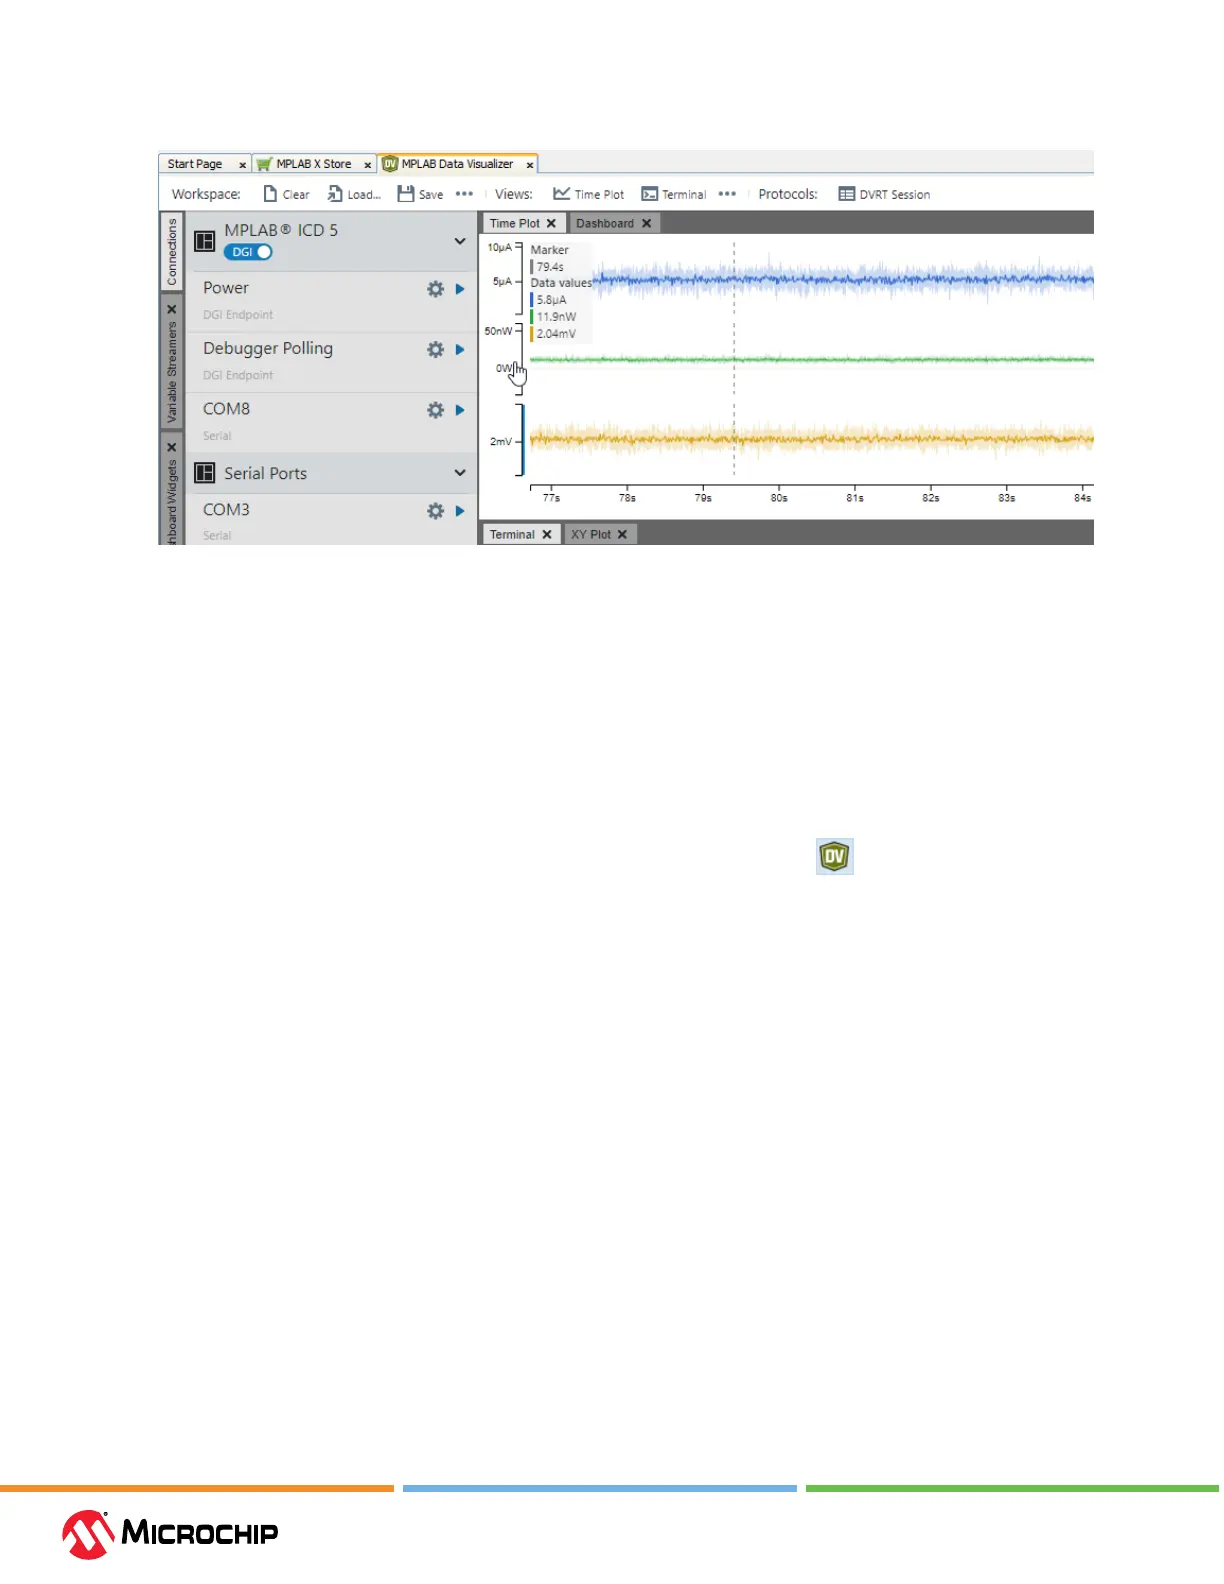
Figure 5-8. Debugger Polling
5.6.1 Requirements
Currently, to use Debugger Polling your project must be set up for these supported devices:
• AVR-8bit devices (UPDI interface)
• ARM-32bit devices (SWD interface)
5.6.2 Operaon
The Debugger polling uses the SWD interface of SAM 32-bit devices and UPDI interface of AVR 8-bit
devices to access the internal program counter location. It provides timestamped samples of the
program counter address, allowing an insight in the program execution of the device.
Note: Debugger polling is only available when MPLAB Data Visualizer is run from within
MPLAB X IDE. This allows the data visualizer access the debug system on the device through the
MPLAB X IDE backend.
Note: Debugger polling requires that the debugger is running, i.e., select “Debug Project” in MPLAB
X IDE.
5.7 Power Monitor
The MPLAB ICD 5 In-Circuit Debugger can be a power monitor. Power monitoring means capturing
power data, such as current values. When power is supplied by the debugger, the Vdd and GND lines
can be monitored and power data gathered.
Power Monitoring is available for the following Microchip devices: PIC
®
, dsPIC
®
, AVR
®
and SAM MCU.
DGI (data gateway interface) Power Monitoring is limited to debuggers/kits that support the DGI and
have the additional circuitry for power measurement, which includes the ICD 5.
The debugger works with the MPLAB Data Visualizer to provide plots of power data. As of MPLAB
X IDE v5.50, the MPLAB DV plugin is included with the IDE. A separate stand-alone version is also
available.
Note: You can only use USB communication with the data visualizer.
For more on this software, see the MPLAB Data Visualizer Product Page.
5.7.1 About Power Monitoring
When the MPLAB ICD 5 is connected to and powering the target, the following can be measured: