5352 A
DVANCED IMAGE PROCESSING
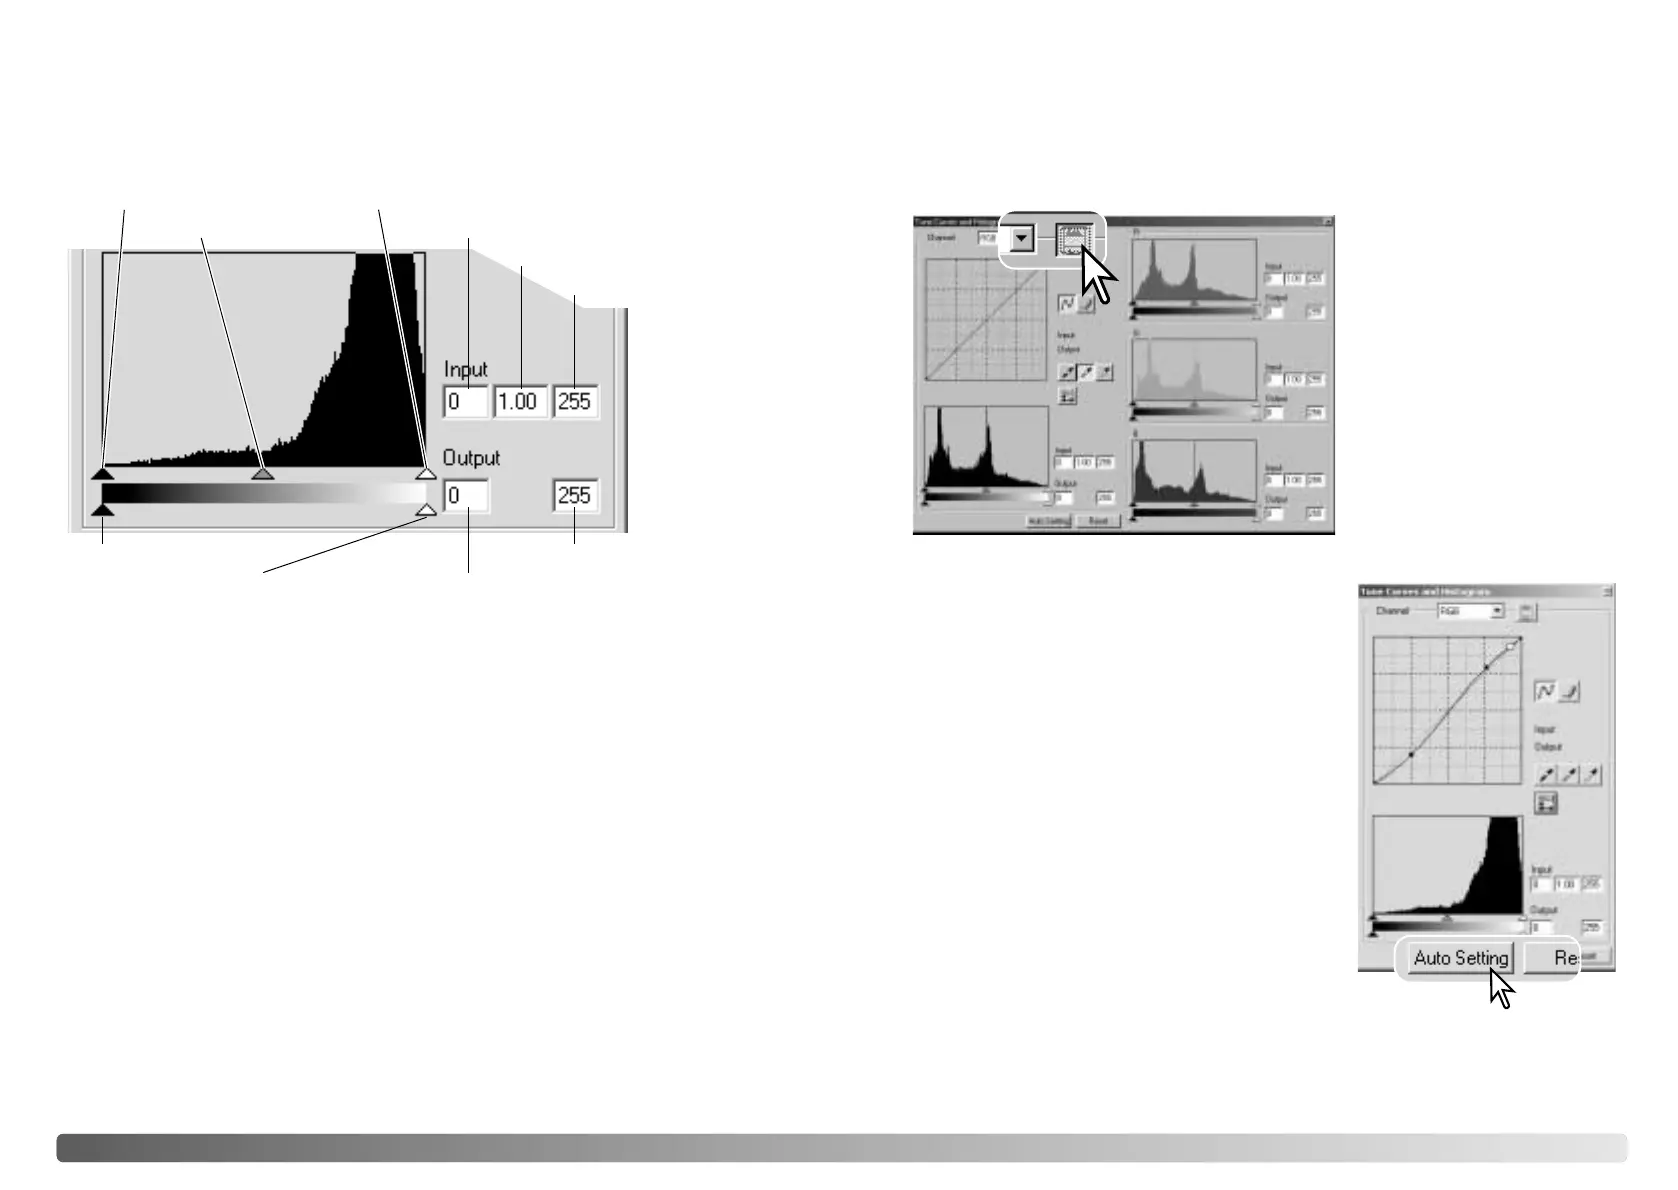
Histogram corrections
The histogram indicates the distribution of pixels with specific brightness or color
values in the image. Using the histogram can maximize the output of the image data.
Changes made with the histogram are also displayed on the tone curve.
Input shadow slider
Input gamma slider
Input highlight slider
Input shadow text box
Input gamma text box
Input highlight text box
Output shadow slider
Output highlight slider Output shadow text box
Output highlight text box
The color histograms can be displayed with the channel list box or with keyboard
shortcuts. While holding the control key (Windows) or command key (Macintosh),
press 0 (zero) to display the RGB channel, 1 to display the red channel, 2 to display
the green channel, or 3 to display the blue channel.
The histogram can be used to maximize the distribution of the pixels in the image. The
highlight level, shadow level, and gamma can be set manually with the sliders or text
boxes.
The gamma slider defines the mid-tones of the image. Dragging the gamma slider to
the right will darken the image, and dragging it to the left will brighten it. Similar to the
tone-curve correction described on page 50, the gamma slider allows the brightness
of the image to be adjusted without loosing image information.
The input highlight slider sets the white level. As the slider is moved to the left, an
apparent increase in contrast can be seen in the displayed image. All pixels to the right
of the slider are set to 255 and any image detail they may contain will be lost. This can
be an important tool for improving copy images of text on a white background. Uneven
illumination, or faded or stained paper can be distracting when copying text or line art.
By adjusting the white level, the imperfections of the white background can be
eliminated leaving only the darker text visible.
The input shadow slider sets the black level. As the slider is moved to the right, an
apparent increase in contrast can be seen in the displayed image. All pixels to the left
of the slider are set to 0 and any image detail they may contain will be lost.
The black and white output levels can be adjusted. By moving the output highlight and
shadow sliders, the contrast of the image can be reduced.
The auto-setting function automatically adjusts the
tone curve and histogram to maximize image
contrast and color. The darkest pixels in the image
are set to a black level of 0, the brightest pixels are
set to a white level of 255, and the rest of the pixels
are distributed between them equally.
Click the auto-setting button. The change is
immediately reflected in the displayed image. To
view the change in the histogram, press the apply
button. Click the reset button to cancel the auto
setting.
Click the color-histogram button
to view the red, green, and blue
histograms.
Click the histogram RGB display
button again to close the color
histogram display.
Tone curve / histogram auto setting