Operating Instructions MG3 Digital
Technical Description
76609409EN-BA-MG3D-V1_6.docx 9/82 2010-08-02
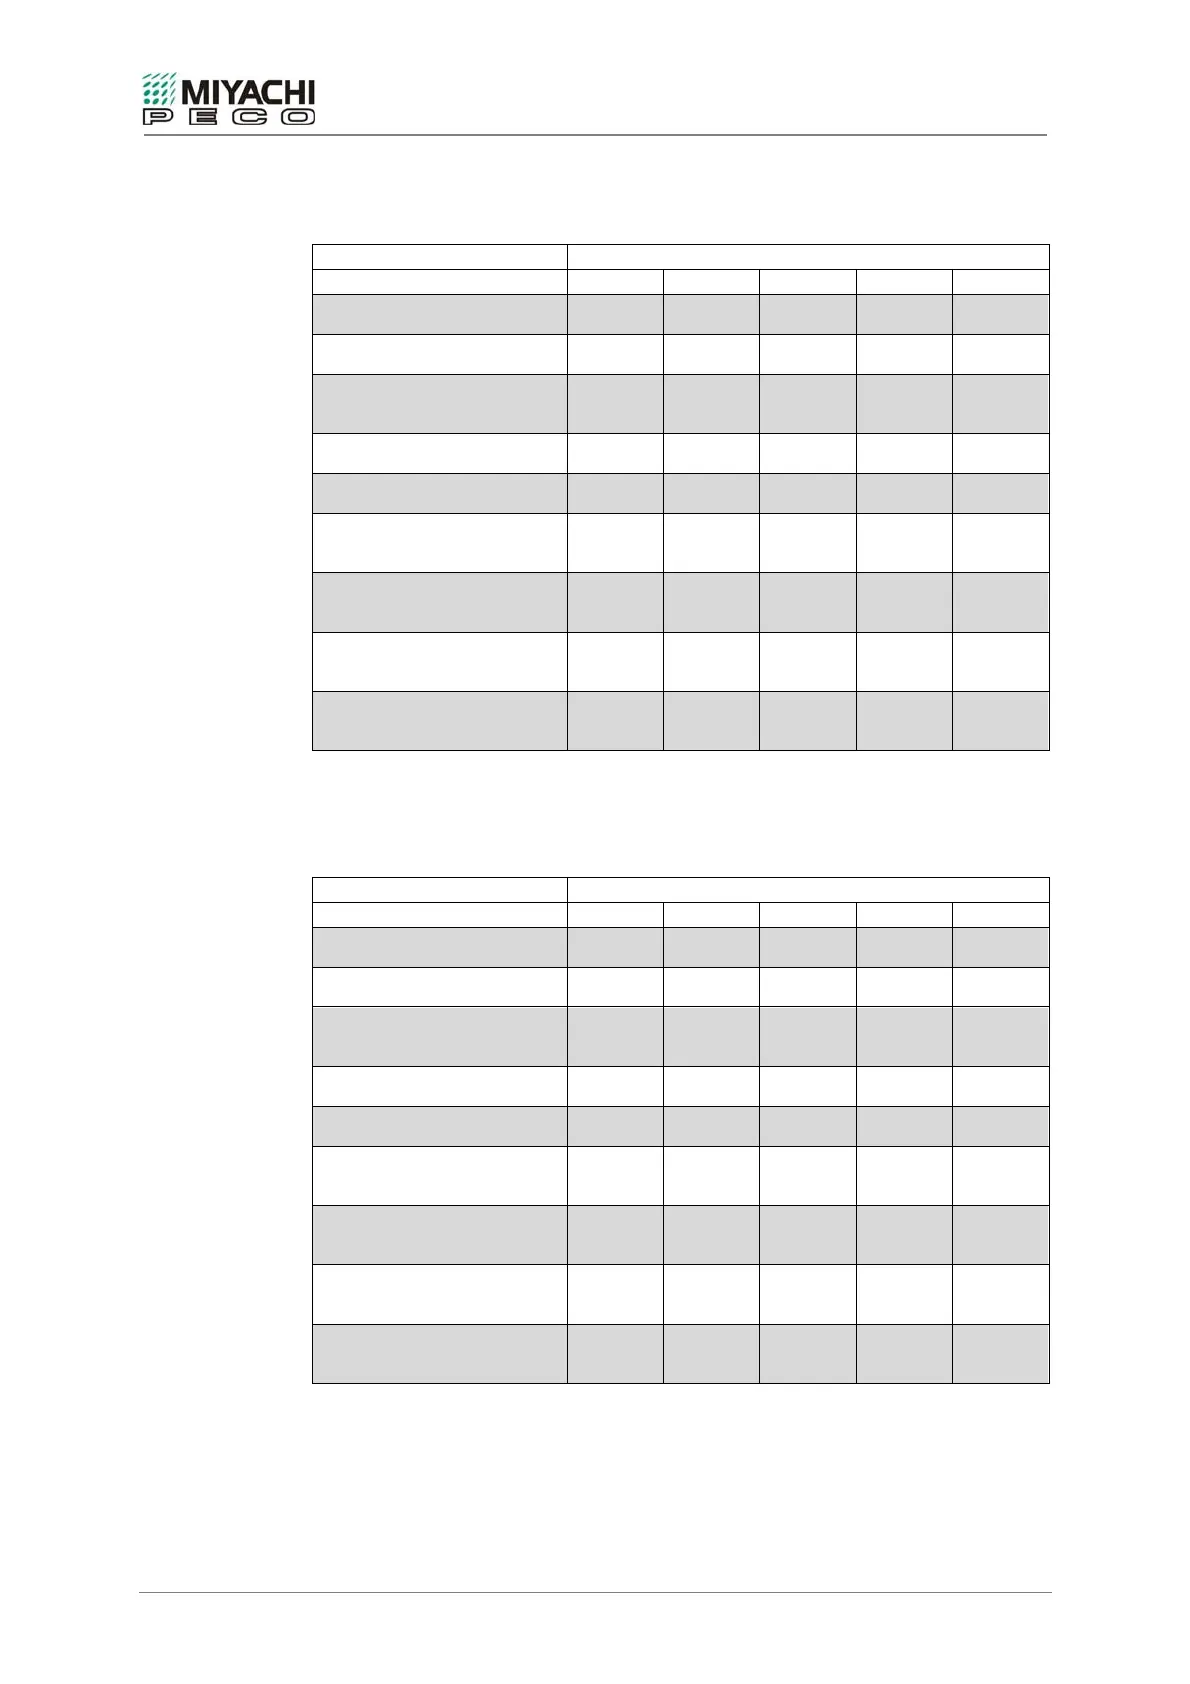
Maximum cycle for AC current
All specifications for active ready-output-inquiries.
Current display AC current in [periods] 50Hz
Measuring time 1 per. 2 per. 6 per. 13 per. 25 per.
Quadrant 1-4 numerical
Logging = on
125 ms
480
140 ms
428
230 ms
260
360 ms
166
600 ms
100
Quadrant 1-4 numerical
Logging = off
120 ms
500
140 ms
428
230 ms
260
360 ms
166
600 ms
100
Quadrant 1-4 graphical
I(1),U(2),P(3),W(4)
Logging = off
1630 ms
36
1670 ms
35
1750 ms
34
1910 ms
31
2190 ms
27
34Quadrant 1-4 SPC chart
Logging = off
210 ms
285
220 ms
272
230 ms
260
340 ms
176
590 ms
101
Analysis window
Logging = on
200 ms
300
220 ms
272
260 ms
230
420 ms
142
630 ms
95
Logging window
Logging = on
Last
300 ms
200
380 ms
157
440 ms
136
500 ms
120
680 ms
88
Logging window
Logging = on
All
390 ms
153
430 ms
139
470 ms
127
500 ms
120
650 ms
92
Graphic display
(waveform I)
Logging = on
550 ms
109
610 ms
98
640 ms
93
790 ms
75
1100 ms
54
Graphic display
(waveforms I/U/P/W)
Logging = on
1580 ms
37
1650 ms
36
1690 ms
35
1840 ms
32
2140 ms
28
Tbl. 1: Maximum cycle for AC – active
Maximum cycle for DC current
All specifications for active ready-output-inquiries.
Current display DC current in [ms]
Measuring time 23 ms 50 ms 100 ms 250 ms 500 ms
Quadrant 1-4 numerical
Logging = on
130 ms
461
170 ms
352
190 ms
315
340 ms
176
602 ms
99
Quadrant 1-4 numerical
Logging = off
126 ms
476
170 ms
352
190 ms
315
340 ms
176
602 ms
99
Quadrant 1-4 graphical
I(1),U(2),P(3),W(4)
Logging = off
1635 ms
36
1672 ms
35
1710 ms
34
1870 ms
32
2170 ms
27
Quadrant 1-4 SPC chart
Logging = off
130 ms
461
180 ms
333
210 ms
285
350 ms
171
620 ms
96
Analysis window
Logging = on
220 ms
272
240 ms
250
280 ms
214
400 ms
150
630 ms
95
Logging window
Logging = on
Last
250 ms
240
340 ms
176
380 ms
157
490 ms
122
680 ms
88
Logging window
Logging = on
All
390 ms
153
420 ms
142
470 ms
127
500 ms
120
660 ms
90
Graphic display
(waveform I)
Logging = on
550 ms
109
610 ms
98
640 ms
93
790 ms
75
1100 ms
54
Graphic display
(waveforms I/U/P/W)
Logging = on
1580ms
37
1650ms
36
1690ms
35
1840ms
32
2140ms
28
Tbl. 2: Maximum cycle for DC - active
 Loading...