highlight graphs.
display is called up.
x
1 0
x
10
1 0 0 - 0 0 1 5100-0015 1 515
L
NN
x
1 0
x
10
L
NN
x
1 0
x
10
L
NN
x
1 0
x
10
L
NN
[ 3 6 4 8 x 2 7 3 6 , 1 / 8 ][3648x2736,1/8]
x
1 0
x
10
’ 0 7 . 1 2 . 1 6’07.12.16 2 1 : 5 621:56
1 0 0 - 0 0 1 5100-0015 1 515
L
NN
1 / 2 5 0 F 5 . 6250 F5.6
+ 2 . 0 4 5 m m+2.0 45mm
I S O 1 0 0ISO 100
0 . 00.0
A : 0A: 0
WB : AUTOWB : AUTO
G : 0G: 0
NATURALNATURAL
s R G BsRGB
L
NN
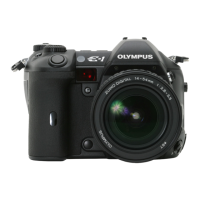
Highlight display
Image only Information 1 Information 2
Shadow display Highlight display Histogram display
Histogram
*
Shooting
information
Displays the frame
number, print reservation,
protect, record mode and
file number
Displays the frame number, print
reservation, protect, record mode,
number of pixels, compression rate,
date and time and file number
Distribution of the brightness of the
recorded image is displayed in a
histogram (brightness component
graph).
The overexposed
(highlighted) parts of the
recorded image blink.
The underexposed
(shadowed) parts of the
recorded image blink.
*Histogram
If the bars in the histogram are higher on
the right, the image may be too bright. If
the bars are higher on the left, the image
may be too dark. Compensate the
exposure or shoot again.
Overall
information