388
Graphs
Section 7-10
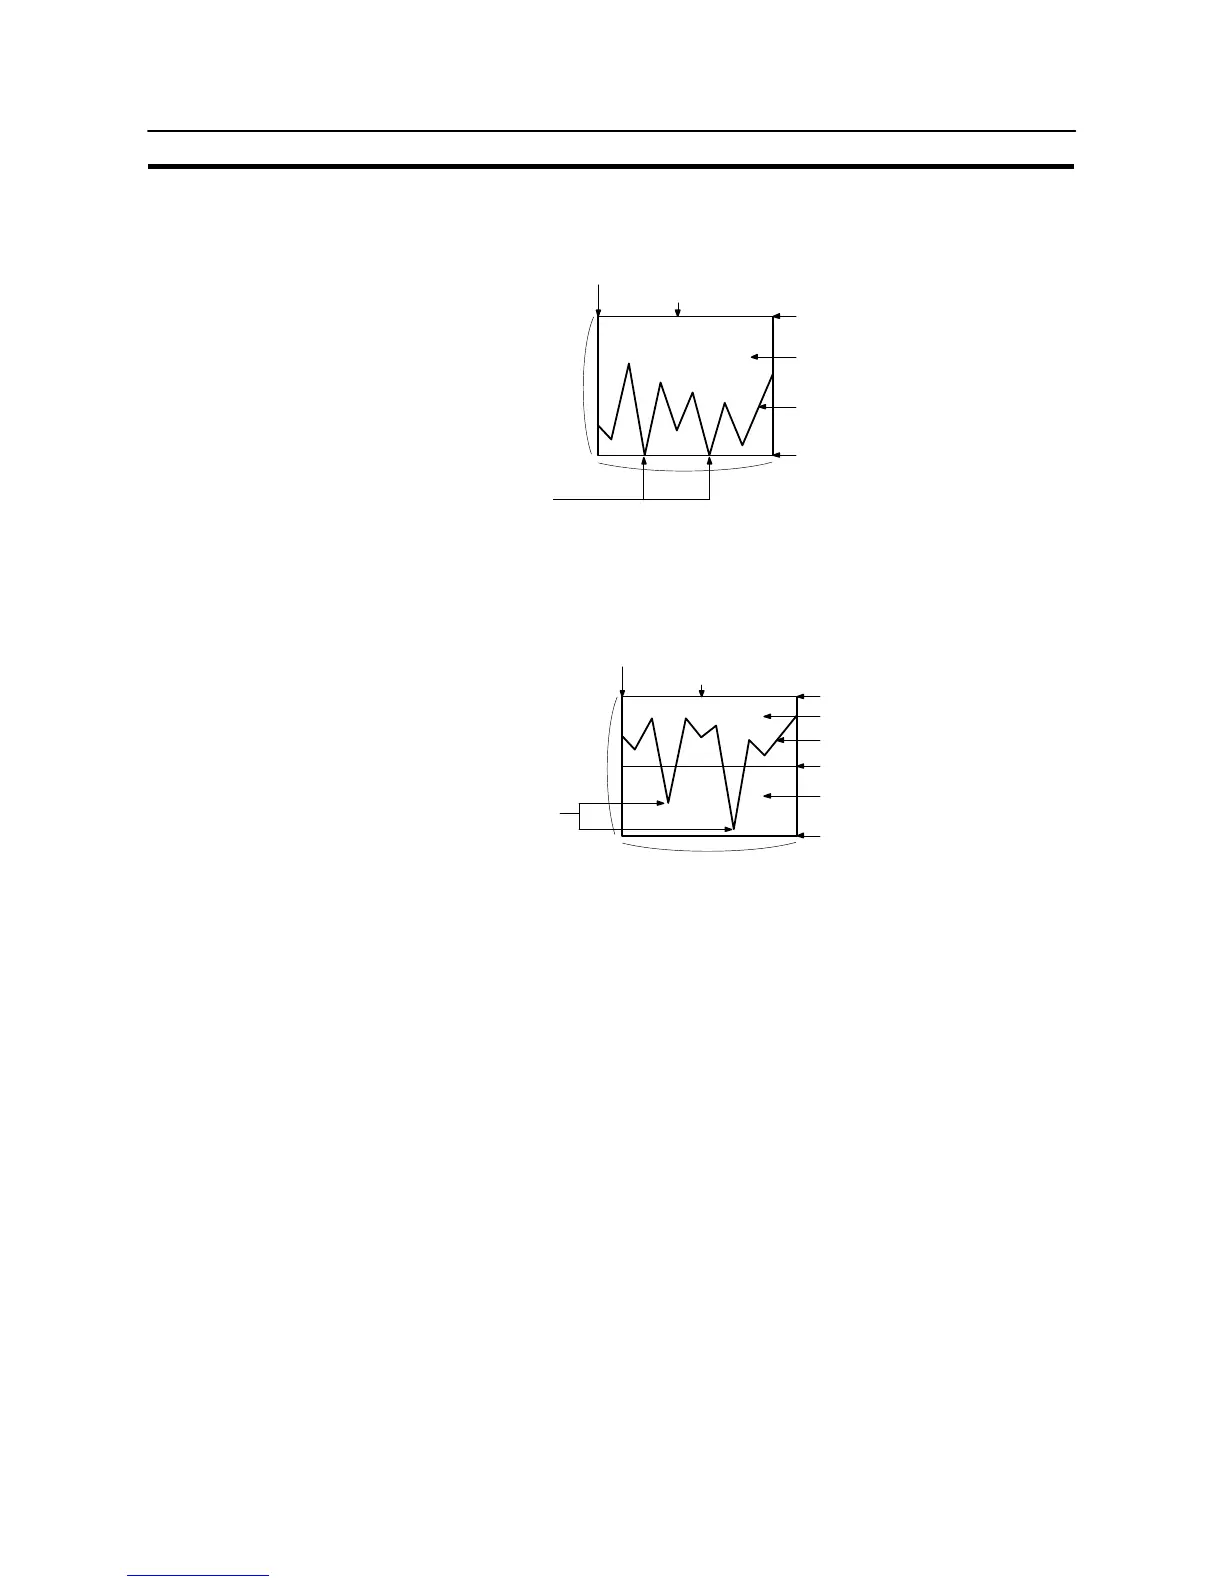
S Resulting display
<When no check mark is set for “Display Sign”>
Size
(X direction)
Position
(Top left corner of the rectangular area including the graph)
Frame color
100% position
Size
(Y direction)
Display color for the + range
Line (color, style)
0% position
Negative values
are not displayed.
<When a check mark is set for “Display Sign”>
In this case, the center of the graph is always the 0% position, regardless of the
settings made for “100%”, “0%”, and “−100%”.
Position
(Top left corner of the rectangular area including the graph)
Frame color
100% position
Display color of + range
Size
(Y direction)
Line (color, type)
0% position
Display color of − range
Negative values
are displayed.
Size (X direction)
−100% position