392
Graphs
Section 7-10
In the case of trend graphs comprising past values recorded with the logging
function, up to eight broken lines can be registered for one screen.
S Trend graphs cannot be specified indirectly using a numeral memory table.
They must be specified by direct reference.
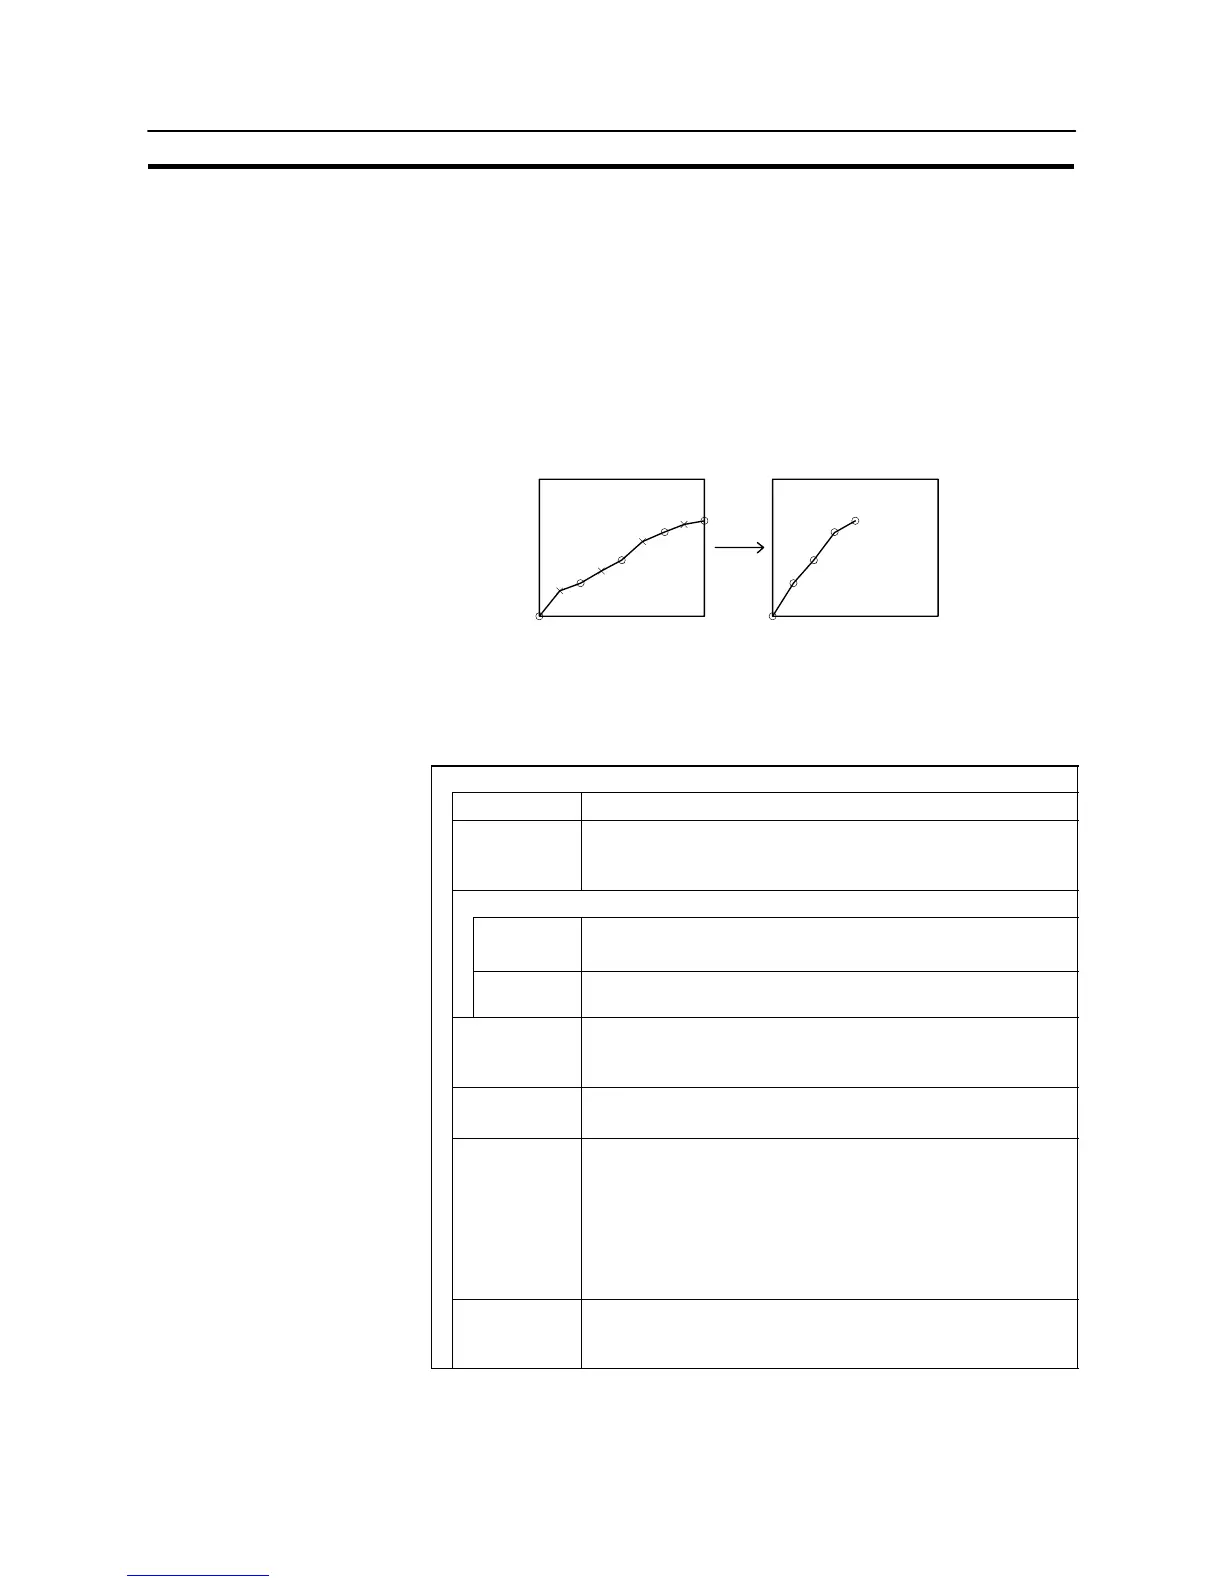
S If the set sampling cycle is shorter than the time taken for display update proc-
essing, sampling results that cannot be processed in time are skipped and the
data will not be displayed correctly.
Example: The data indicated by marks in the graph on left cannot be pro-
cessed in time for screen updating, and is skipped; therefore only
the data indicated by f is displayed and the result is as shown in
the graph on the right.
[Common Attributes]
The relationship between the properties of a trend graph and the display results is
indicated below.
S Properties
General
Position Coordinates of the top left corner of the graph area.
Size Width and height of the area in which the trend graph is
displayed (dot units)
Width: 2 to 320 Height: 2 to 240
Display
Type Method for drawing the line (“Line drawing method”, page 398)
Standard/Pen Reco
Drawing
Width
Interval between consecutive data on the drawn graph in dot units
(“Drawing width”, page 397)
Frame Whether or not a frame is displayed for the graph area
Check mark (frame displayed)/
No check mark (frame not displayed)
Display Sign Whether or not a negative area is displayed.
Check mark (displayed)/No check mark (not displayed)
Direction Direction of motion of the graph (“Line drawing method”, page
398)
Up/down/left/right
For standard type:
Direction of motion from the latest drawing position
For pen recording type:
Direction of motion of the line as a whole
Sampling
Cycle
Cycle (time interval) for data reading (graph updating)
Range: 0.5 to 6553.5 in 0.5 second units
(5 to 65535 ( 0.1) for entry; must be a multiple of 5)