Monitoring and Analysis Tools Spectrum Analyzer Tool
OceanTRx
TM
4-500 Installation and Operations Manual 9-3
9.1.1 Navigating the Spectrum Analyzer Tool
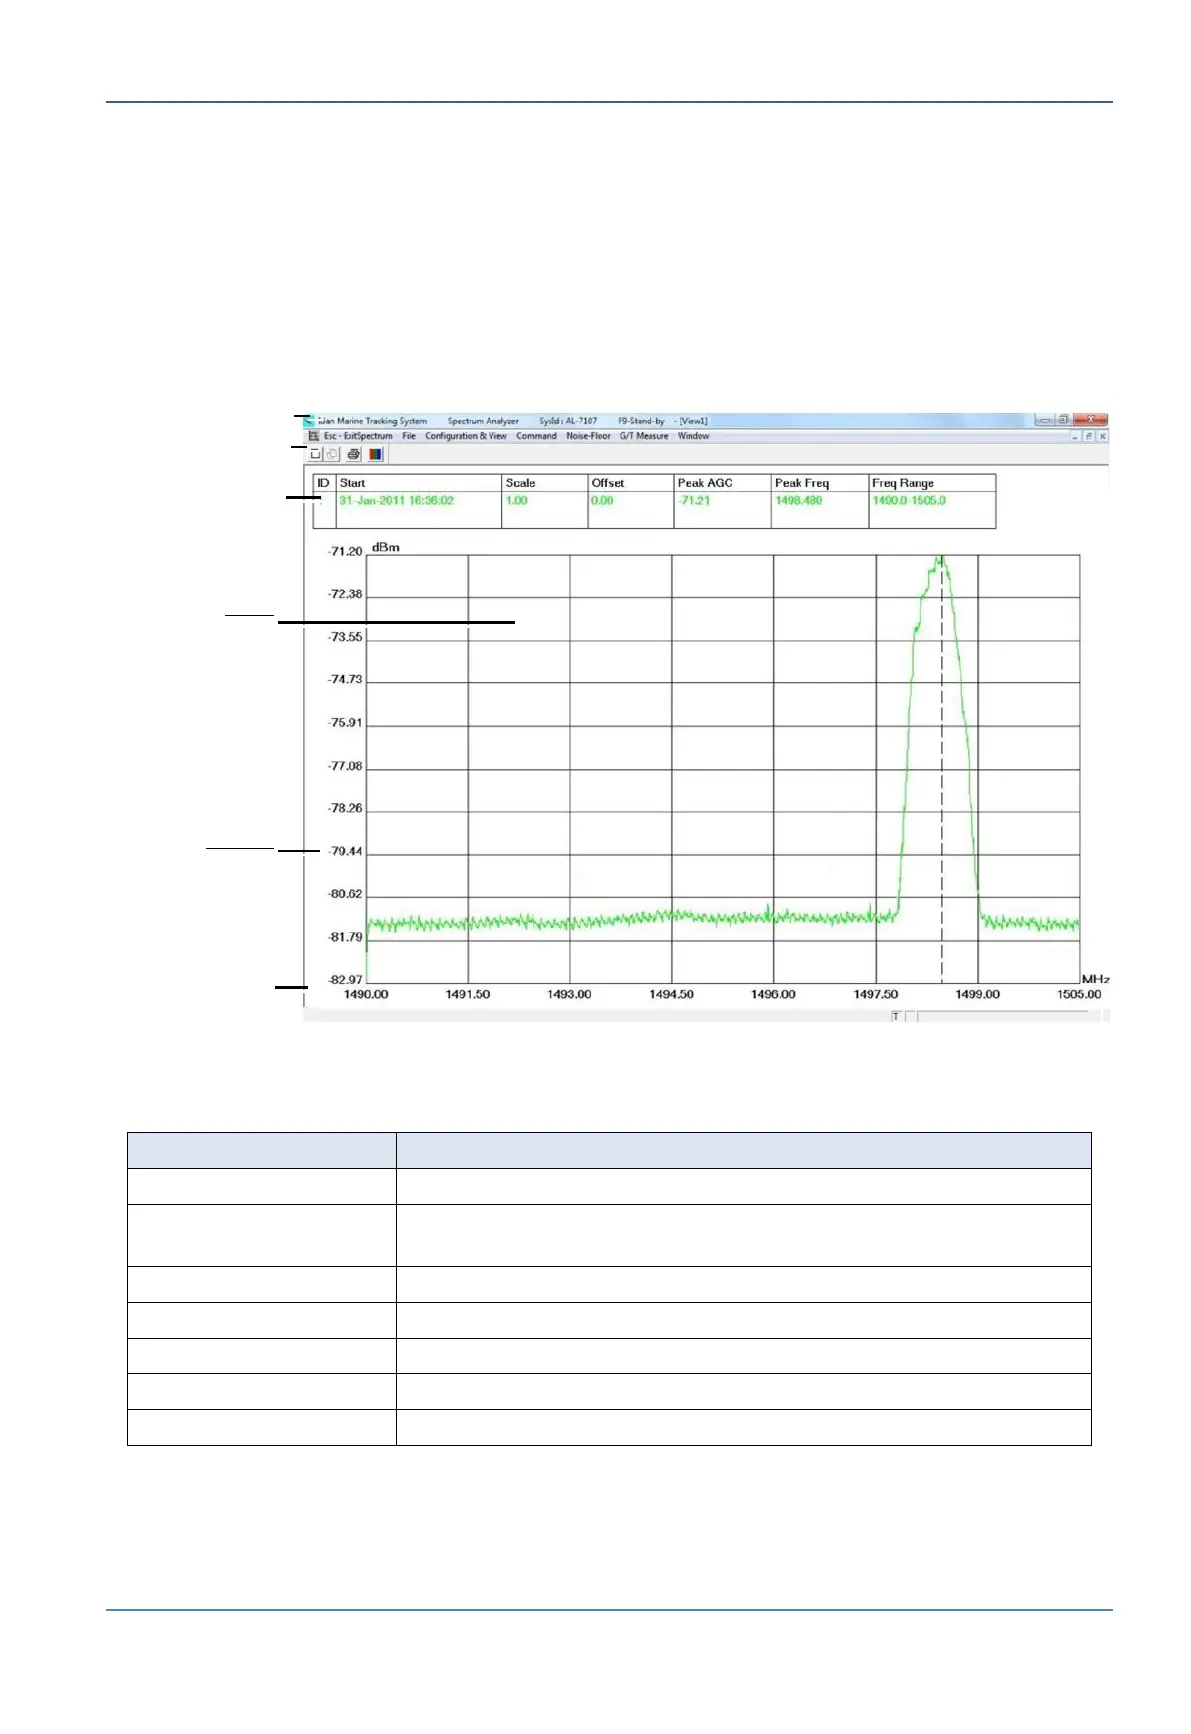
To Access the Spectrum Analyzer Screen
From the Operation screen or from the Maintenance Screen, select the Spectrum
menu option. The spectrum analyzer screen appears. The following figure illustrates a
display with acquired data (the initial screen is empty).
Figure 9-1: Spectrum Analyzer Screen example
Menu Bar
Goes back to the previous screen.
Open a saved graph, save or restore saved Spectrum
Analyzer setup (data acquisition and display)
Customize the acquisition and the view of data.
Initiate and control the data acquisition process.
Noise Floor calibration options.
Window Display management.
Defined Freq
Display Range
Defined Power
Display Range